
“Oil can. Oil can!”
– The Tin Man, The Wizard of Oz
Considering its central role in the largest financial crisis in living memory, the U.S. housing market isn’t getting the attention it deserves from economists and investors. Construction and sales of homes, though only contributing modestly to GDP in a direct way, are leading indicators for much of the rest of the U.S. economy, including consumption and employment.
Housing has been there for every high and low in the economic maelstrom that began in 2020. Today, the combination of high interest rates and high prices has made housing affordability the worst it has ever been since the National Association of Realtors created the Housing Affordability Index.

Poor affordability is a large part of the story of poor home sales growth this year. But it’s not the whole story. No other segment of the U.S. economy has experienced a stranger landing than the U.S. housing market. So, let’s fly over the rainbow and explore what’s happening and how it informs our outlook.
“It really was no miracle. What happened was just this…” – Housing’s strange journey since 2020
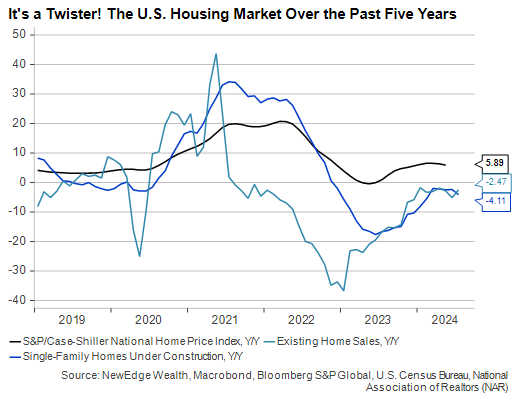
The pandemic initially affected the U.S. housing market in the same way as it did the rest of the economy. Demand and supply both collapsed for a short period before demand roared back, leaving supply in its dust. Single-family home construction was flat in 2019 and during the first half of 2020, so when ultra-low interest rates and a sudden change in lifestyle preferences caused demand to boom, prices shot up.
Construction eventually ramped up in 2020 and 2021, but materials and labor shortages coupled with higher interest rates quickly brought new supply growth to a halt. While applications for building permits are now above their cycle lows, the number of homes currently under construction (the best indicator of how many new homes will soon be available) is down 20% from its 2021 peak and hit a fresh 3-year low in July.
“Pay no attention to that man behind the curtain.” – Fed policy has broken the housing market
The Fed’s interest rate policy has had a large role in U.S. housing’s strange journey. Low rates and rising demand in the 2010s and early 2020s pushed home inventories to historically low levels, supporting prices. But while inventory growth has picked up since rising rates began rising in 2022, the number of homes listed for sale remains low by recent historical standards.
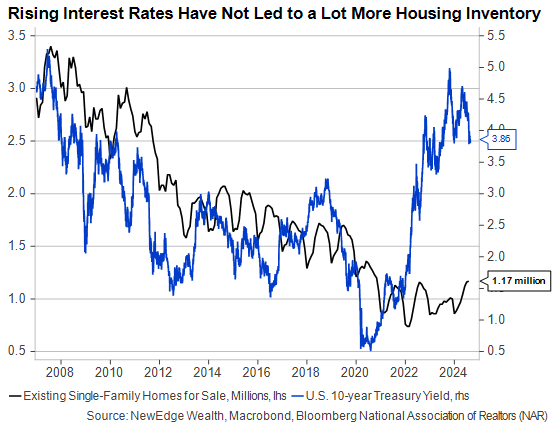
Anyone expecting tighter monetary policy to crash home prices was looking only at rates’ demand impact while ignoring their supply impact. When both sales and inventories are languishing in depressed territory, it suggests that a lack of new listings (i.e., supply) is at least as big a factor as a lack of willing homebuyers.
According to the latest U.S. census data, close to 40% of homes are mortgage-free, while most others were financed at the extraordinary low rates of the prior cycle. In fact, less than 2% of mortgages were floating rate in 2020, with only 5% having floating rates at the start of the Fed’s hiking cycle in 2022. This is a stark contrast to 2005 prior to the Great Financial Crisis, when over 35% of mortgages were floating rate. As the Fed raised rates beginning in 2004 and mortgage rates reset higher, many homeowners were priced out of their existing mortgages, causing a wave of foreclosures and falling home prices.

This dynamic of locked-in low-rate mortgages has resulted in an unprecedented spread between the rate experienced by the existing mortgages in the U.S. and the rate to secure a new mortgage.
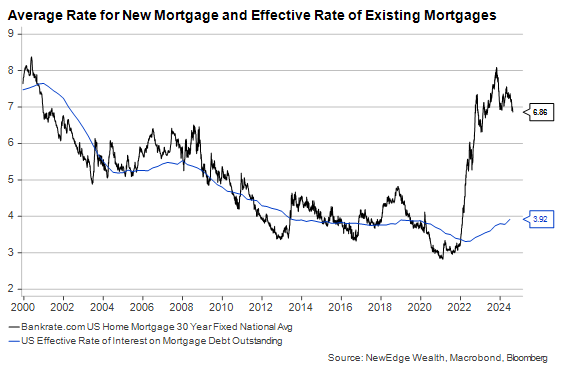
Like the rusted Tin Man in the woods, many homeowners who might otherwise prefer to move find themselves locked into homes with low-rate mortgages, keeping existing home inventories low and home prices high.
“I’ve got a plan to get in there.” – Homebuyers are hungry to buy but responsive to affordability
The Fed didn’t mean to freeze the housing market. Really, it didn’t. It’s just that inflation was on fire and demanded a sharp increase in interest rates. Looking even further back, the frozen housing market is arguably an unintended consequence of the prior cycle’s unprecedented policy of keeping long-term interest rates suppressed through Quantitative Easing.
The trouble now is that no one precisely knows what it will take to unfreeze the market. Long-term interest rates are already down a lot since their October 2023 peak, yet the number of mortgage applications for purchase is still close to its low for this cycle.
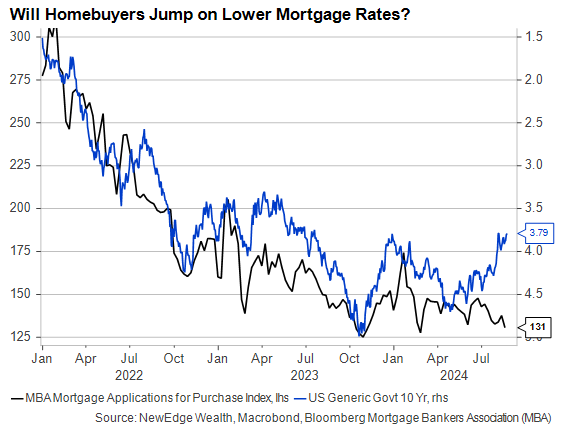
The lack of activity generated by this summer’s rate swoon is concerning, since it might signal that lower mortgage rates have come at the cost of diminished consumer confidence. At the same time, affordability remains a challenge, even with lower rates. Prices have continued to rise, albeit at a slower pace, with supply tight and a larger-than-normal share of buyers not using mortgages.
There are some early signs the frozen housing market may be starting to thaw, including in the most recent survey of banks’ lending practices. The Fed’s Senior Loan Officer Opinion Survey (SLOOS) for Q2 showed more banks willing to ease lending standards for homebuyers and more potential buyers showing interest in loans.
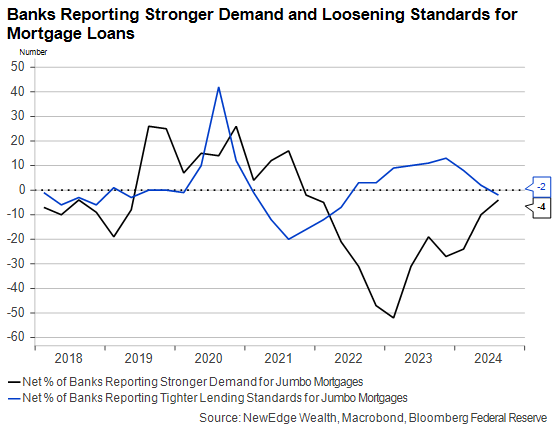
Despite this good news, from a starting point of depressed sales volume and mortgage applications, rate cuts alone will probably fail to return the market to its 2019 baseline, let alone its 2021 euphoria. The only way to increase sales and improve affordability is through an increase in housing supply.
“Don’t stand there talking. Put me together!” – More Homes Are Needed to Improve Affordability
The best way to bring the housing market back into balance is by increasing supply. While rate cuts alone cannot ensure this, they could stir an increase in sales and prices over the next few quarters, which in turn could incentivize builders to take on more projects, if the past is any guide.

Of course, decisions about home construction and zoning are made at the state and local level, not by members of the FOMC. But single-family home affordability is not going to improve until the Fed at least begins to ease policy to help induce more sales and more building. If the Fed waits too long to cut rates and accidentally allows the economy to fall into recession, many potential buyers would undoubtedly stay on the sidelines while more homeowners would be forced by economic circumstances to sell. Sales and prices would fall together.
Unfortunately, increasing home supply isn’t a policy that can work overnight, and even the benefit of Fed rate cuts is likely to be muted with peak selling season receding into the rearview mirror. Even in the best-case scenario of falling rates and resilient growth, we may not get a durable pickup in home sales until sometime in the Spring of 2025.
“Now begone, before somebody drops a house on you!” – Investing Outlook for Housing Stocks
Lower rates are the “oil can” the housing market needs right now, but the rewards for investors holding housing-related sectors of the U.S. equity market will vary depending on where they choose to allocate.
This chart highlights the major housing-related sectors of the S&P 500. Most of the 2024 gains have come during the current quarter as long-term rates have fallen and easier Fed policy has been pulled forward. Homebuilders and Residential REITs are more immediately sensitive to easier financial conditions, while home improvement retailers, who have reported weak consumer demand this year and cut their revenue outlooks, may take longer to fully discount an improvement in the housing market.
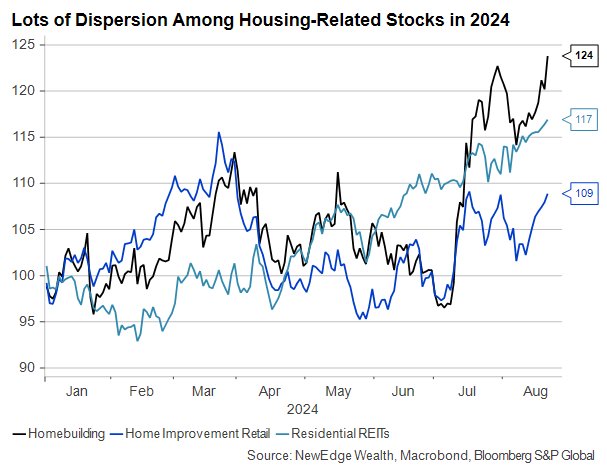
Most investors feel changes in the housing market chiefly through the change in value of their own homes. But stronger home sales would benefit the broader economy through the downstream economic activity they produce, especially construction and consumer spending. We won’t know for several quarters whether the Fed can tap its heels together and help get the housing market back to normal.
The views and opinions included in these materials belong to their author and do not necessarily reflect the views and opinions of NewEdge Capital Group, LLC.
This information is general in nature and has been prepared solely for informational and educational purposes and does not constitute an offer or a recommendation to buy or sell any particular security or to adopt any specific investment strategy.
NewEdge and its affiliates do not render advice on legal, tax and/or tax accounting matters. You should consult your personal tax and/or legal advisor to learn about any potential tax or other implications that may result from acting on a particular recommendation.
The trademarks and service marks contained herein are the property of their respective owners. Unless otherwise specifically indicated, all information with respect to any third party not affiliated with NewEdge has been provided by, and is the sole responsibility of, such third party and has not been independently verified by NewEdge, its affiliates or any other independent third party. No representation is given with respect to its accuracy or completeness, and such information and opinions may change without notice.
Investing involves risk, including possible loss of principal. Past performance is no guarantee of future results.
Any forward-looking statements or forecasts are based on assumptions and actual results are expected to vary from any such statements or forecasts. No assurance can be given that investment objectives or target returns will be achieved. Future returns may be higher or lower than the estimates presented herein.
An investment cannot be made directly in an index. Indices are unmanaged and have no fees or expenses. You can obtain information about many indices online at a variety of sources including: https://www.sec.gov/answers/indices.htm.
All data is subject to change without notice.
© 2024 NewEdge Capital Group, LLC


