Just a series of blurs, like I never occurred
Someday, you will be loved
“Someday You Will Be Loved” – Death Cab for Cutie
Note: Value and Growth in this piece refer to the Russell 1000 Value and Growth Indices, respectively. All data is via Bloomberg unless otherwise noted.
We continue our unofficial summer series looking at the “left behind” portions of the global equity market (we began with a look at small caps and then international stocks) with a look at Value and its dismal relative performance versus the S&P 500 and Growth stocks.
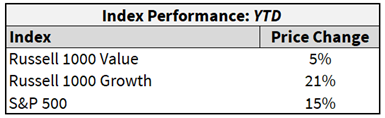
As you can see in the table above, Growth has continued to trounce Value in 2024, outperforming by 16%, even after the Growth index bested Value by over 30% in 2023.
At the start of 2024, we wrote about Growth vs. Value, saying it was too early to call for a big rotation out of Growth into Value but that there were puts and takes in each cohort of stocks. Over the course of 2024, these puts and takes have become even more amplified by Growth’s continued outperformance.
For Growth, valuations have become even more stretched and positioning even more crowded (mainly in the Technology sector), but positive earnings revisions and strong growth narratives have fueled powerful stock gains.
For Value, valuations remain reasonable, and positioning remains light, but this has not been enough to counteract negative EPS revisions and the lack of a narrative to support growth optimism.
This piece will unpack these dynamics and present necessary catalysts for a rotation, whenever that someday is that Value will be loved.
(Note: we were tempted to do a section on the role of Fed policy on Value stocks just so we could call it “Death Cab for QT” but we managed to restrain ourselves).
And the Memories of Me Will Be More Like Bad Dreams: Historical Growth vs. Value Cycles
As you can see in the chart and table below, the Growth vs. Value trade has a history of experiencing big, long cycles: the late 1990s Tech bubble favoring Growth, the early 2000s Tech-bust/International boom favoring Value, the post-Great Financial Crisis recovery favoring Growth (with a post-COVID blow off top of outperformance in 2020-2021), the valuation reset of 2022 favoring Value (the briefest of the cycles), and today’s AI/mega-monopoly fueled rally favoring Growth.
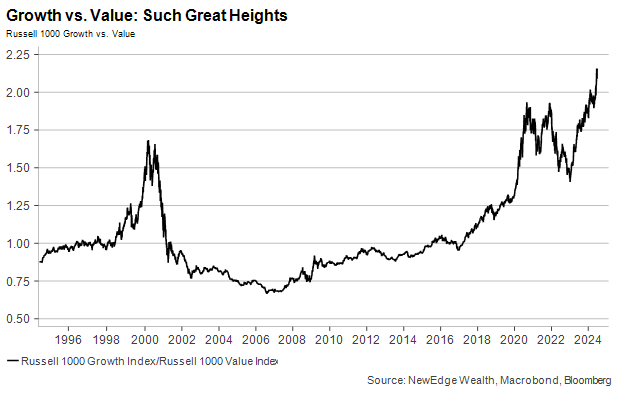
Just like our work on international relative performance, this is a good reminder that big leadership rotations do happen (even if they seem impossible given the dominant narratives of the day), and that they tend to happen after extremes are reached in valuation and positioning.
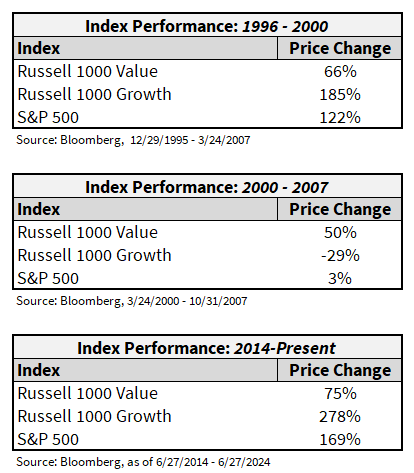
For example, Value’s outperformance in the 2000s was, of course, boosted by the commodity supercycle, the boom in international markets, and the unsustainable global banking bacchanal, which all led to stronger earnings growth for Value (+70%) versus Growth (+50%) from 2000-2007.
But Value’s outperformance was also a function of Growth’s descent from purely silly valuations, with Growth’s PE falling -70% vs. Value’s -17% contraction from 2000-2007.
Given the importance of these earnings and valuation trends, let’s take a look at today’s set up for each measure.
All Beauty and Truth: Earnings and Valuations
We think the key reason for Growth’s outperformance in 2023 and 2024 has been due to its superior earnings growth and positive earnings revisions. This has created a backdrop for risk-on sentiment and allowed for robust valuation multiple expansion.
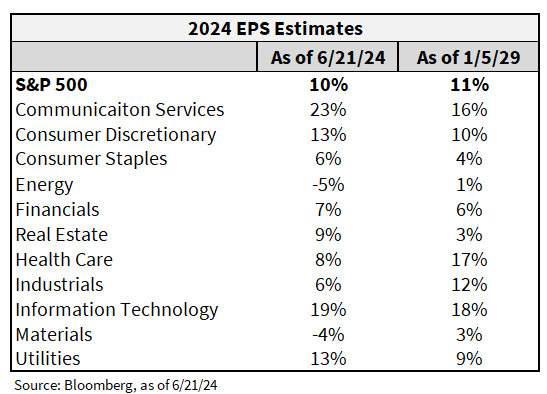
Below, you can see the stark divergence between Value’s falling/flat EPS estimates and Growth’s rising forecasts. Over the last year, 2024 EPS estimates are -4% for Value and +11% for Growth, while 2025 EPS estimates are flat for Value and +14% for Growth.
No wonder Growth has outperformed! Until there is a viable reason for Value earnings to improve, we expect Value underperformance to persist.


Valuations have amplified this divergence in earnings, with more valuation expansion for Growth than Value in 2024. Growth’s 12-month forward PE is +11% YTD vs. +2% for Value.
This multiple expansion has resulted in Growth’s premium over Value to surpass its 2021 peak of 80%. This is double the long-term average premium valuation, and though we push back heavily on benchmarking to once-in-a-generation extreme asset bubbles, we note that this premium remains well below the ridiculous 180% premium reached in 2000.

The conclusion from these observations is that earnings growth and positive earnings revisions have continued to support Growth’s outperformance and have fueled the growing gap in relative valuations (the phrase “cheap for a reason” applies to Value).
For there to be a durable shift in leadership away from Growth into Value, Growth earnings likely need to stumble or at least be outshined by Value. Notably, this happened in 2022’s brief Growth malaise, with Growth EPS only +1% in 2022 vs. Value’s +3.5%.
‘Cause Each Broken Heart Will Eventually Mend: Catalysts for a Change in Earnings Growth Leadership
To start explaining Growth’s earnings leadership over Value, appreciating the difference in sector weights between the two indices is necessary.
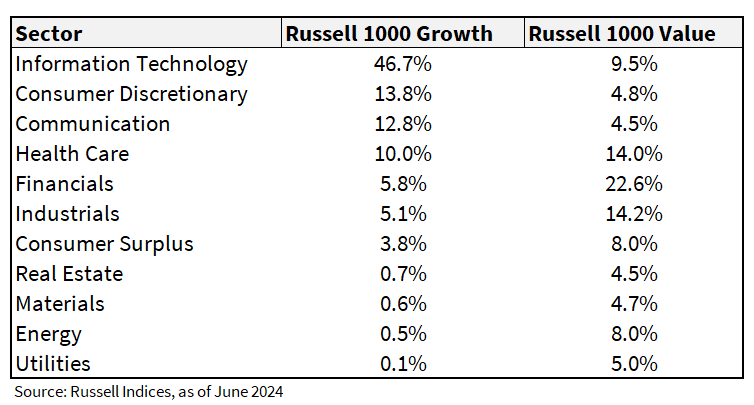
Growth’s exposure to Tech, Discretionary, and Communication Services (the home of the Magnificent 7 stocks) has now reached a whopping 73.3%. These sectors have benefited from positive/stable earnings revisions YTD, as shown in the table below.
Compare this to Value’s largest weights of Health Care, Financials, and Industrials, which make up 50.8% of the Value index. Health Care and Industrials have seen some of the largest earnings estimate cuts in 2024, along with Energy, which is another large weight in the Value index.
There are a few catalysts that could get Value sector EPS moving. For example: a commodity upcycle that boosts Industrials, Materials, and Energy (this would be helped by a weaker US dollar and likely be accompanied by better international stock performance); or an un-inversion of the yield curve and a return to healthy capital market activity that boosts Financials; or finally moving past the COVID distortions to achieve better Health Care growth.
But we also have to think about what could cause Growth earnings to slow/stumble. In 2022, it was slowing top-line growth after the COVID boom in sales that clashed with bloated cost structures from the COVID binge in hiring/spending. Looking forward, we should consider factors like: a pull-forward of semi-conductor spending on AI that eventually slows (semis are a highly cyclical industry); a slowing in economic growth that hits advertising and consumer-oriented names (Meta, Google, Amazon, Apple); and anti-trust regulation.
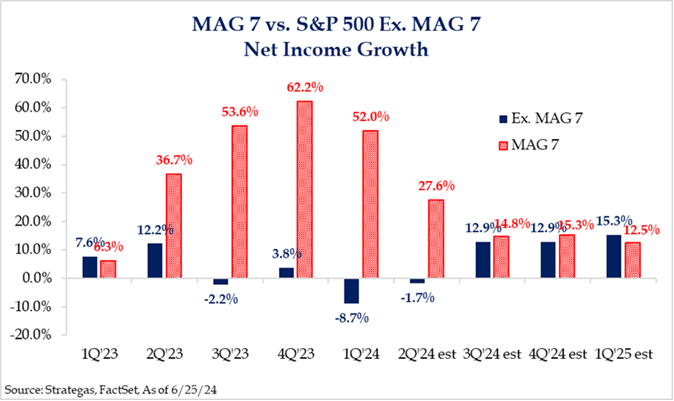
This also raises an important point about the pace of growth of the Magnificent 7 names, which make up 51.9% of the Russell 1000 Growth Index.
The chart below from Strategas highlights how the market expects a sharp slowing in Mag 7 profit growth and a big acceleration from the rest of the S&P 500 to pick up the slack as we move into 2H24 and into 2025. The year-over-year comparisons are easier for the Ex Mag 7 cohort, but this is a high bar for the “rest” of the market to jump over.
Lastly, there is an important catch: even if you adjust the sector weights to match the S&P 500 and then screen for the cheapest stocks, Value has still underperformed. This is captured below by the VLUE iShares Value Factor ETF, a sector-neutral ETF isolating the Value factor. This implies that cheap stocks are underperforming now matter what sector they are in, with the market willing to “pay up” for strong growth stories across sectors.
iShares Value Factor ETF (VLUE) Absolute (top) and Relative to the S&P 500 (bottom)

Your Heart Belongs to Someone You’ve Yet to Meet: Lower Concentration Creates Opportunities for Stock Selection
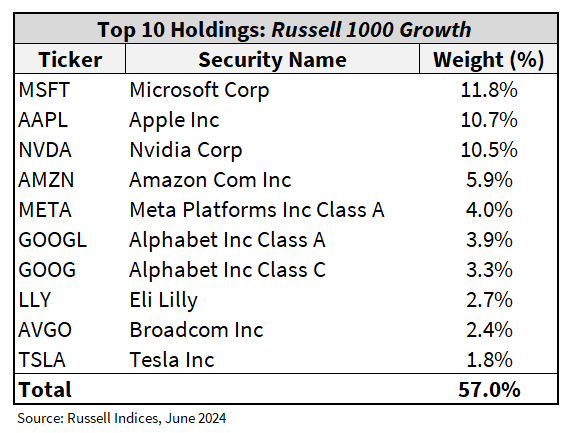
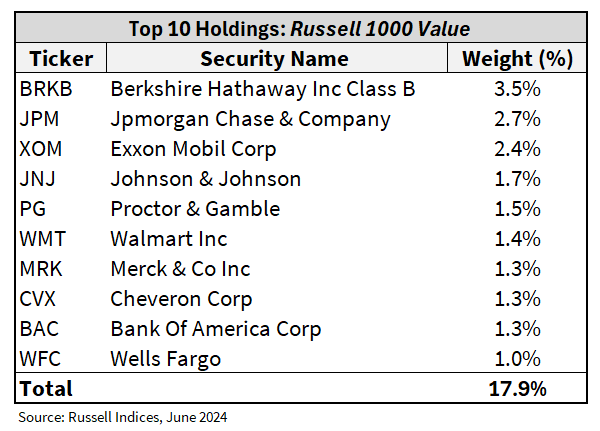
The tables below show the top ten holdings for the Growth and Value indices. It paints a clear picture about the difference in concentration between the two indices, with Growth having 57% in its top ten names (58.5% if you collapse both share classes of Google and include Visa) and Value only having 17% in its top ten.
We think the lack of concentration in Value creates more opportunity to add value through stock selection/active management, mostly focusing on quality companies with earnings consistency, lower debt levels, resilient profit margins, strong cash generation, and high return on invested capital.
Think of it as the Growth index is the 1927 Yankees, full of superstar winners like Babe Ruth and Lou Gehrig, whereas Value is the 2002 Oakland A’s, full of “diamonds in the rough” that need strong coaching and selection in order to succeed.
Someday is Not Today: Conclusion
As we look back at the last 18 months, Growth has outperformed Value for a solid reason: Growth earnings growth has been superior to Value.
Going back to the 1995-2000 Growth cycle, fascinatingly, Growth EPS growth actually trailed Value EPS growth, +57% vs. +73%, respectively. This meant Growth’s massive performance during that time was built on the shakiest ground of valuation expansion.
Today, we see earnings superiority as the key reason for Growth dominance to continue but are growing increasingly wary of stretched valuations and positioning, mostly if these factors continue to expand even as Growth’s EPS gains begin to moderate in 2025 (driven by a slowing in Mag 7 growth).
Eventually, likely just as Growth valuations, narrative, and positioning all hit an extreme fever pitch as they did in 2000 or 2021, Value will have its day. That day may not be today, but that does not mean to eschew Value entirely. Instead, the conclusion is to be highly selective within Value investments.
And so, we repeat our conclusion from the international piece: trees can grow a lot longer than you think, but they typically stop short of the sky.
IMPORTANT DISCLOSURES
Index Information: Russell 1000 Growth Index measures the performance of the large- cap growth segment of the US equity universe. It includes those Russell 1000 companies with relatively higher price-to-book ratios, higher I/B/E/S forecast medium term (2 year) growth and higher sales per share historical growth (5 years). The Russell 1000 Value Index measures the performance of the large cap value segment of the US equity universe. It includes those Russell 1000 companies with relatively lower price-to-book ratios, lower I/B/E/S forecast medium term (2 year) growth and lower sales per share historical growth (5 years).
The views and opinions included in these materials belong to their author and do not necessarily reflect the views and opinions of NewEdge Capital Group, LLC.
This information is general in nature and has been prepared solely for informational and educational purposes and does not constitute an offer or a recommendation to buy or sell any particular security or to adopt any specific investment strategy.
NewEdge and its affiliates do not render advice on legal, tax and/or tax accounting matters. You should consult your personal tax and/or legal advisor to learn about any potential tax or other implications that may result from acting on a particular recommendation.
The trademarks and service marks contained herein are the property of their respective owners. Unless otherwise specifically indicated, all information with respect to any third party not affiliated with NewEdge has been provided by, and is the sole responsibility of, such third party and has not been independently verified by NewEdge, its affiliates or any other independent third party. No representation is given with respect to its accuracy or completeness, and such information and opinions may change without notice.
Investing involves risk, including possible loss of principal. Past performance is no guarantee of future results.
Any forward-looking statements or forecasts are based on assumptions and actual results are expected to vary from any such statements or forecasts. No assurance can be given that investment objectives or target returns will be achieved. Future returns may be higher or lower than the estimates presented herein.
An investment cannot be made directly in an index. Indices are unmanaged and have no fees or expenses. You can obtain information about many indices online at a variety of sources including: https://www.sec.gov/answers/indices.htm.
All data is subject to change without notice.
© 2024 NewEdge Capital Group, LLC
The post Someday You Will Be Loved?: Value’s Continued Malaise appeared first on NewEdge Wealth.