
A change of speed, a change of style
“New Dawn Fades” – Joy Division
There has been “a change of speed, a change of style” for the U.S. economic growth outlook.
For the first time in over twelve months, U.S. GDP forecasts for 2024 have been trimmed, and with these cuts, the “new dawn” has faded for continued growth acceleration in the U.S.
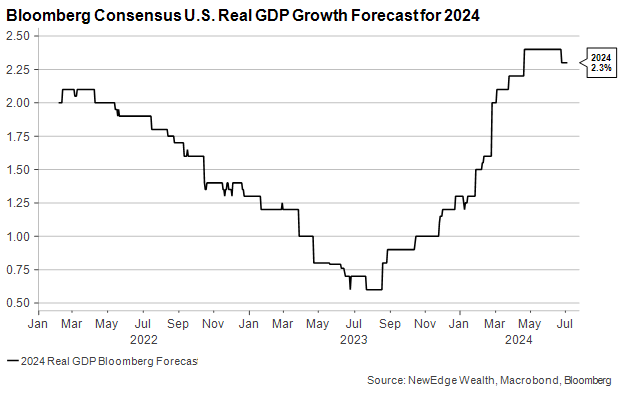
The chart below shows GDP forecasts by quarter, showing how the revisions lower have been driven by slight downside to 2Q24 and 4Q24 estimates.

If this is more than just a blip (it may still be given it is only one data point, but with the evidence we show below, we do think there is more downside to estimates), this would be a marked shift from the environment of rising GDP forecasts that has persisted for the last 18 months, as analysts consistently increased estimates for 2023 and 2024 GDP.
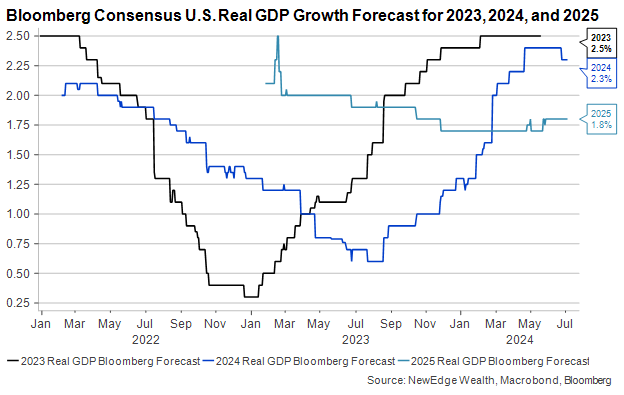
As we wrote in May, arguing that 2024 GDP forecasts had peaked for the year, the backdrop of ever-rising GDP forecasts has been a key support for the strong rally in risk assets since the beginning of 2023. Rising growth forecasts have allowed for stable and rising earnings forecasts, which have helped support valuation expansion for both equities and credit markets.
Below you can see the incredible surge in equity valuations to 21.3x forward PE currently, up 25% since the start of 2023. The valuation expansion has been made possible by this increasingly optimistic growth backdrop, in addition to factors like supportive liquidity, positioning chases/concentrations, and buoyant optimism around Tech/AI narratives.

A similar dynamic around valuations can be seen in the credit markets, where credit spreads have contracted over the course of the last 18 months. The chart below shows the spread of BB bonds over BBB bonds, capturing how much more compensation investors demand for investing in the lowest rung of investment grade credit (BBB) to the highest rung of the junk credit (BB). This measure is below its 2021 tights, and is near its tightest levels in the past 30 years.
The tightness of this spread is made possible by the backdrop of rising growth and profit forecasts over the last 18 months, as investors grew increasingly comfortable with borrowers’ financial health given the economic outlook.
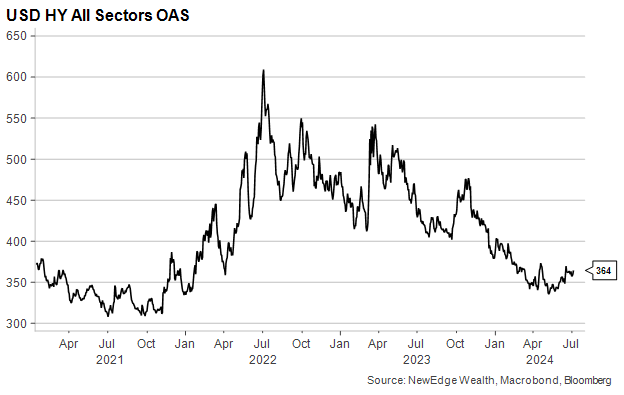
Looking at the High Yield spread alone, the extra yield that High Yield investors demand for taking on credit remains near 2021 ranges but have been climbing slightly in recent weeks. If growth forecasts continue to get cut, we see potential for High Yield spreads to widen out further, potentially causing weaker performance for the asset class.
Given how “priced for perfection” the equity and credit markets are, we have to be ultra-aware of the growth backdrop and monitor the risks that estimates could be cut further.
“Hoping for Something More”: Weaker Data Mounts
This week’s progression of economic data suggests that there could be further downside to GDP estimates.
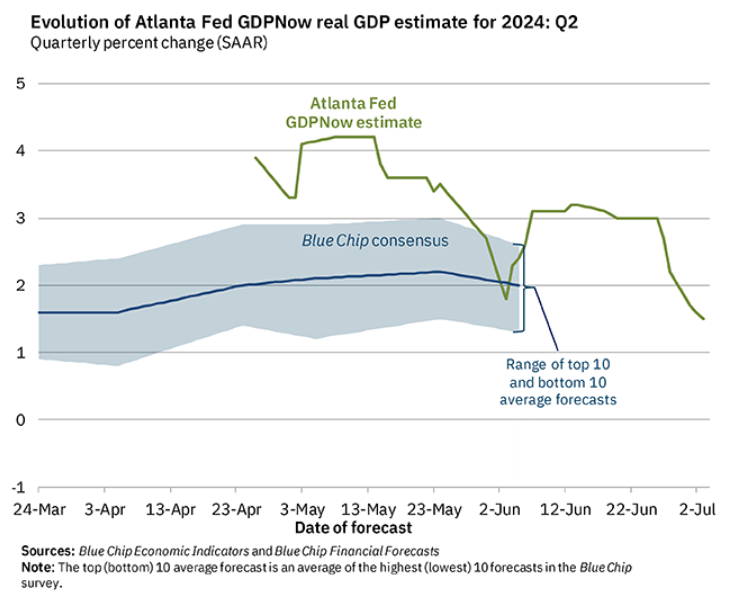
The Atlanta Fed GDPNow measure was marked down further this week, all the way to 1.5% for 2Q24, now below the “blue chip consensus” expectations for the quarter and significantly Bloomberg’s 2.9% consensus forecast. This is significantly lower than the >4% GDP growth projected in May, and marked departure from recent quarters where this GDP Nowcast was consistently above consensus estimates.
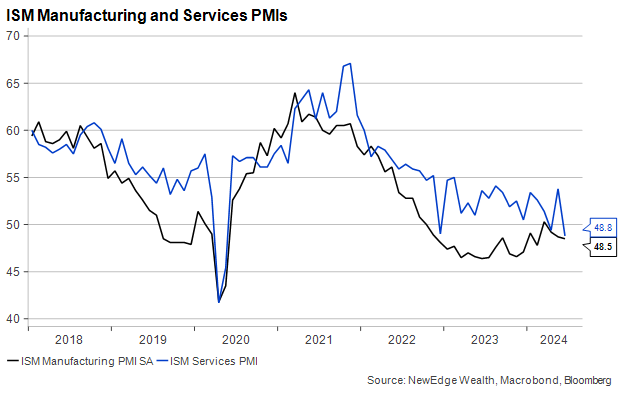
The source of the revisions lower to the GDPNow this week came from weaker data out of the ISM Manufacturing and Services Purchasing Managers Indices. The Services data was particularly weak, falling 5 points to 48.8, the sharpest drop since COVID.
This quote from the Chair of the Institute for Supply Management (ISM), Steve Miller about the Services PMI report is notable:
“The decrease in the composite index in June is a result of notably lower business activity, a contraction in new orders for the second time since May 2020 and continued contraction in employment. Survey respondents report that in general, business is flat or lower, and although inflation is easing, some commodities have significantly higher costs. Panelists indicate that slower supplier delivery performance is due primarily to transportation challenges, not increases in demand.”
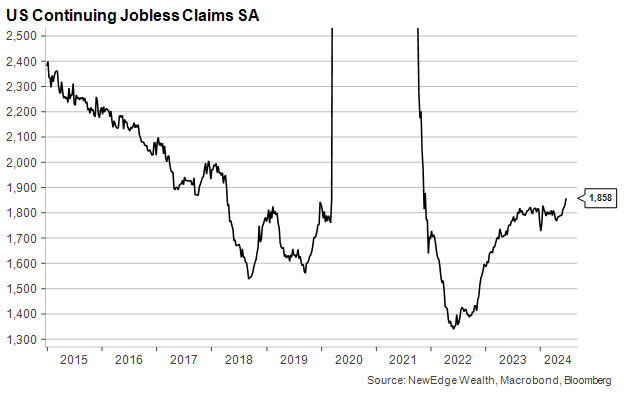
On the jobs front, Friday’s labor market data will be closely monitored (we will provide an assessment in our Monday charts!), mostly given the backdrop of further signs of fraying in the labor market. For example, this week’s Continuing Jobless Claims rose further, as seen in the chart below, with the COVID period truncated.
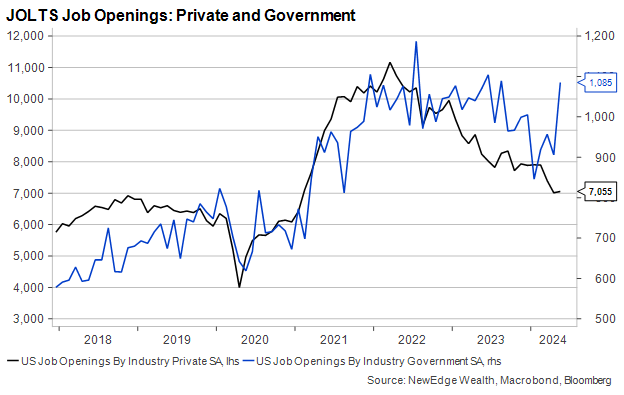
Also note that even though the Job Openings report this week looked to show a healthy jump in job openings, it was entirely driven by Government job openings, with Private job openings showing no improvement.
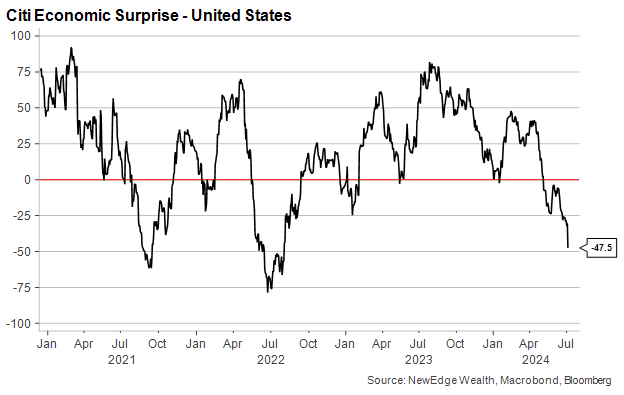
Taking all the recent data together, economic surprises have turned even more deeply negative (this index captures how economic data is coming in versus expectations, with a negative reading reflecting data that is weaker than expected). The last time the economic surprises index was this negative was in 2022, when forward GDP forecasts were being cut materially.
“The strain’s too much, can’t take much more”: Conclusion
Taking all the recent data together, we would not be surprised to see further cuts to 2024 U.S. GDP growth estimates.
U.S. equity markets took the initial revision lower to GDP estimates in stride this week, trading the S&P 500 to a new record on Wednesday, focusing on the prospects of sooner/more Fed support given the weaker data backdrop. Markets seem to also be boosted by a strong uptrend, liquidity support, positive seasonality, and a continued positioning chase. The table from our Monday chart deck shown below, is a helpful outline of the positives and negatives for equity markets in the second half.

If growth estimate cuts continue, this sanguine digestion of weaker data may begin to be challenged. We see potential for credit spreads to widen and equity valuations to fall if growth forecasts continue to get trimmed, given the starting point of being priced for perfection.
We will continue to monitor the progression of data to see if this “new dawn” of growth continues to fade.
IMPORTANT DISCLOSURES
Index Information: All returns represent total return for stated period. S&P 500 is a total return index that reflects both changes in the prices of stocks in the S&P 500 Index as well as the reinvestment of the dividend income from its underlying stocks. Dow Jones Industrial Average (DJ Industrial Average) is a price-weighted average of 30 actively traded blue-chip stocks trading New York Stock Exchange and Nasdaq. The NASDAQ Composite Index measures all NASDAQ domestic and international based common type stocks listed on the Nasdaq Stock Market. Russell 2000 is an index that measures the performance of the small-cap segment of the U.S. equity universe. MSCI International Developed measures equity market performance of large, developed markets not including the U.S. MSCI Emerging Markets (MSCI Emerging Mkts) measures equity market performance of emerging markets. Russell 1000 Growth Index measures the performance of the large- cap growth segment of the US equity universe. It includes those Russell 1000 companies with relatively higher price-to-book ratios, higher I/B/E/S forecast medium term (2 year) growth and higher sales per share historical growth (5 years). The Russell 1000 Value Index measures the performance of the large cap value segment of the US equity universe. It includes those Russell 1000 companies with relatively lower price-to-book ratios, lower I/B/E/S forecast medium term (2 year) growth and lower sales per share historical growth (5 years). The BBB IG Spread is the Bloomberg Baa Corporate Index that measures the spread of BBB/Baa U.S. corporate bond yields over Treasuries. The HY OAS is the High Yield Option Adjusted Spread index measuring the spread of high yield bonds over Treasuries. Atlanta Fed GDPNow index is a “nowcast” of real GDP growth based on available economic data for the current measured quarter.
The views and opinions included in these materials belong to their author and do not necessarily reflect the views and opinions of NewEdge Capital Group, LLC.
This information is general in nature and has been prepared solely for informational and educational purposes and does not constitute an offer or a recommendation to buy or sell any particular security or to adopt any specific investment strategy.
NewEdge and its affiliates do not render advice on legal, tax and/or tax accounting matters. You should consult your personal tax and/or legal advisor to learn about any potential tax or other implications that may result from acting on a particular recommendation.
The trademarks and service marks contained herein are the property of their respective owners. Unless otherwise specifically indicated, all information with respect to any third party not affiliated with NewEdge has been provided by, and is the sole responsibility of, such third party and has not been independently verified by NewEdge, its affiliates or any other independent third party. No representation is given with respect to its accuracy or completeness, and such information and opinions may change without notice.
Investing involves risk, including possible loss of principal. Past performance is no guarantee of future results.
Any forward-looking statements or forecasts are based on assumptions and actual results are expected to vary from any such statements or forecasts. No assurance can be given that investment objectives or target returns will be achieved. Future returns may be higher or lower than the estimates presented herein.
An investment cannot be made directly in an index. Indices are unmanaged and have no fees or expenses. You can obtain information about many indices online at a variety of sources including: https://www.sec.gov/answers/indices.htm.
All data is subject to change without notice.
© 2024 NewEdge Capital Group, LLC
The post New Dawn Fades appeared first on NewEdge Wealth.