
Maverick: She’s lost that loving feeling.
Goose: No, she hasn’t.
Maverick: Yes, she has.
– Top Gun, 1986
Last week, we noted a “change of speed” for the U.S. economic growth outlook. Inflation has resumed its decline, and there are emerging signs of fraying in the U.S. labor market. While equity investors have not yet seen downward GDP revisions as a reason to turn cautious (likely because they also brighten hopes for rate cuts), corporate credit spreads are now several months removed from their 2-year lows. We are becoming concerned that High Yield credit, in particular, may be on the “Highway to the Danger Zone”.
This edition of the Weekly Edge provides an overview of High Yield in the context of our tactical underweight position heading into the second half of 2024. While we see potential for the asset class to underperform in the short-term, we continue to count it as a strategic asset class due to its high coupons, hybrid stock-bond quality, and cyclical properties.
Corporate Bonds Spreads Are “Flying Below the Hard Deck”
As of 7/11/24
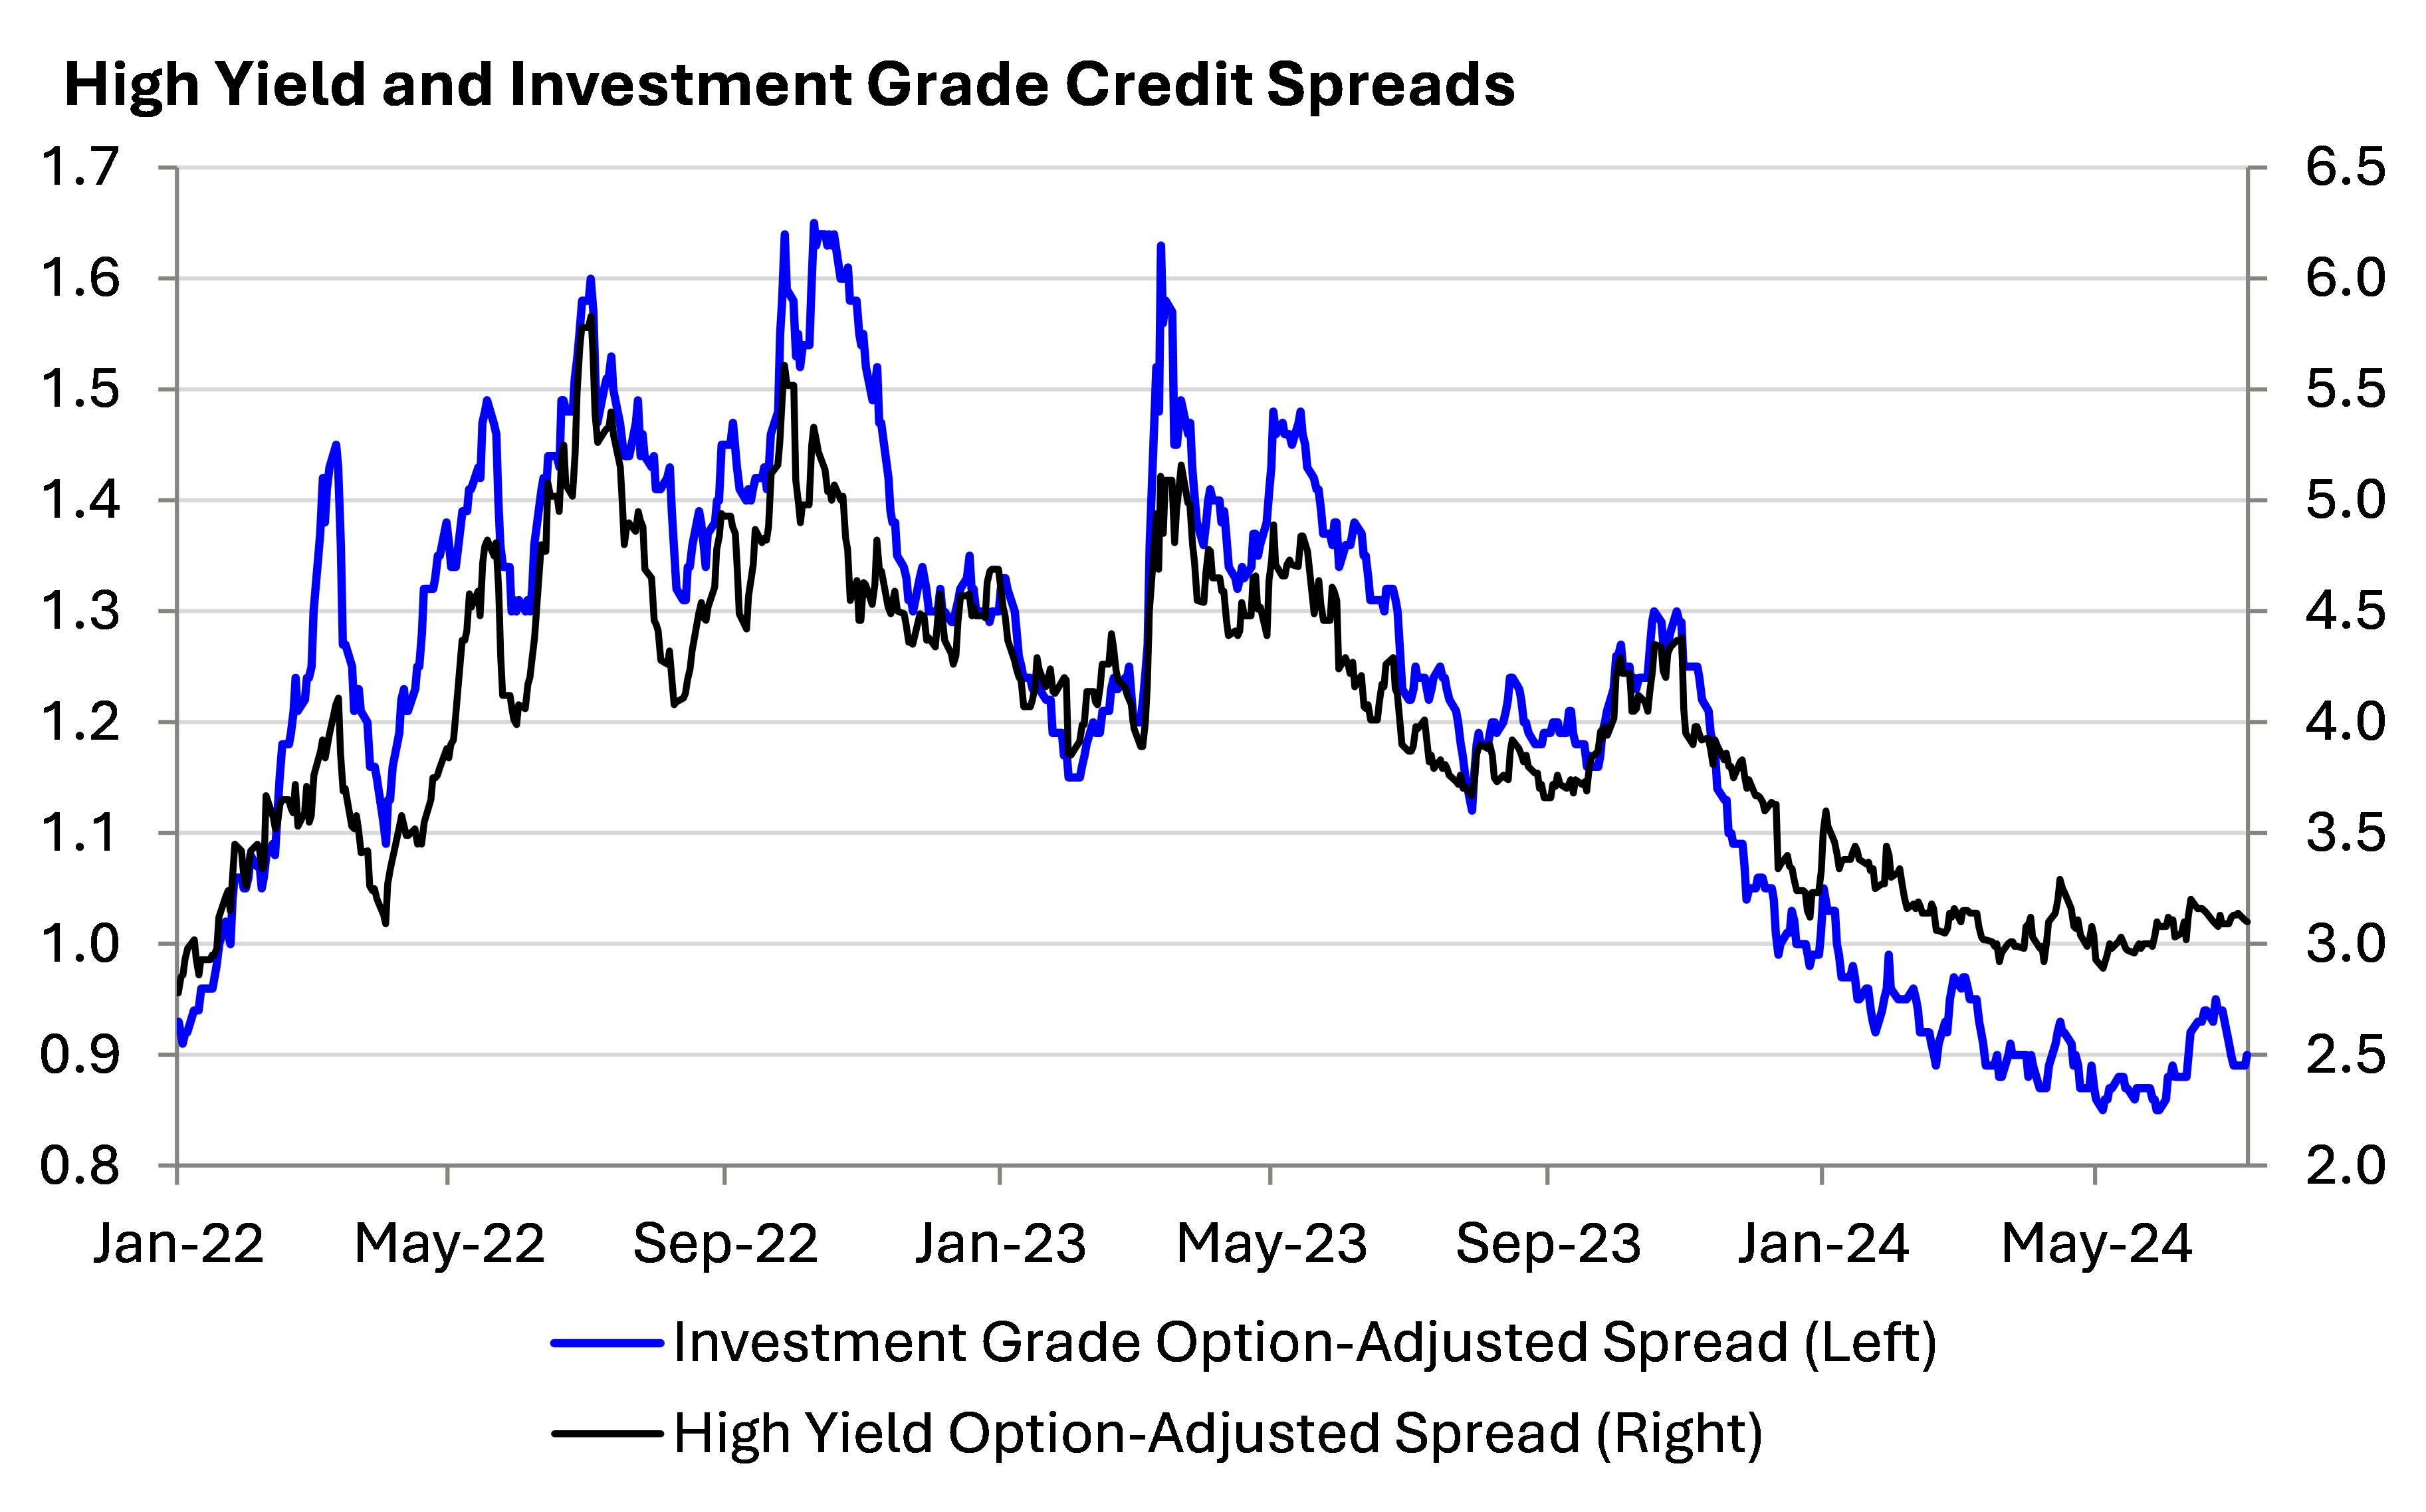
Spreads across the credit spectrum are highly correlated, meaning spreads typically widen or contract for all cohorts of credit together, but spreads on High Yield bonds are consistently wider and more volatile than Investment Grade. This is because companies that issue this “junk” debt are likelier to encounter refinancing difficulties and have higher default risk in slower growth environments.
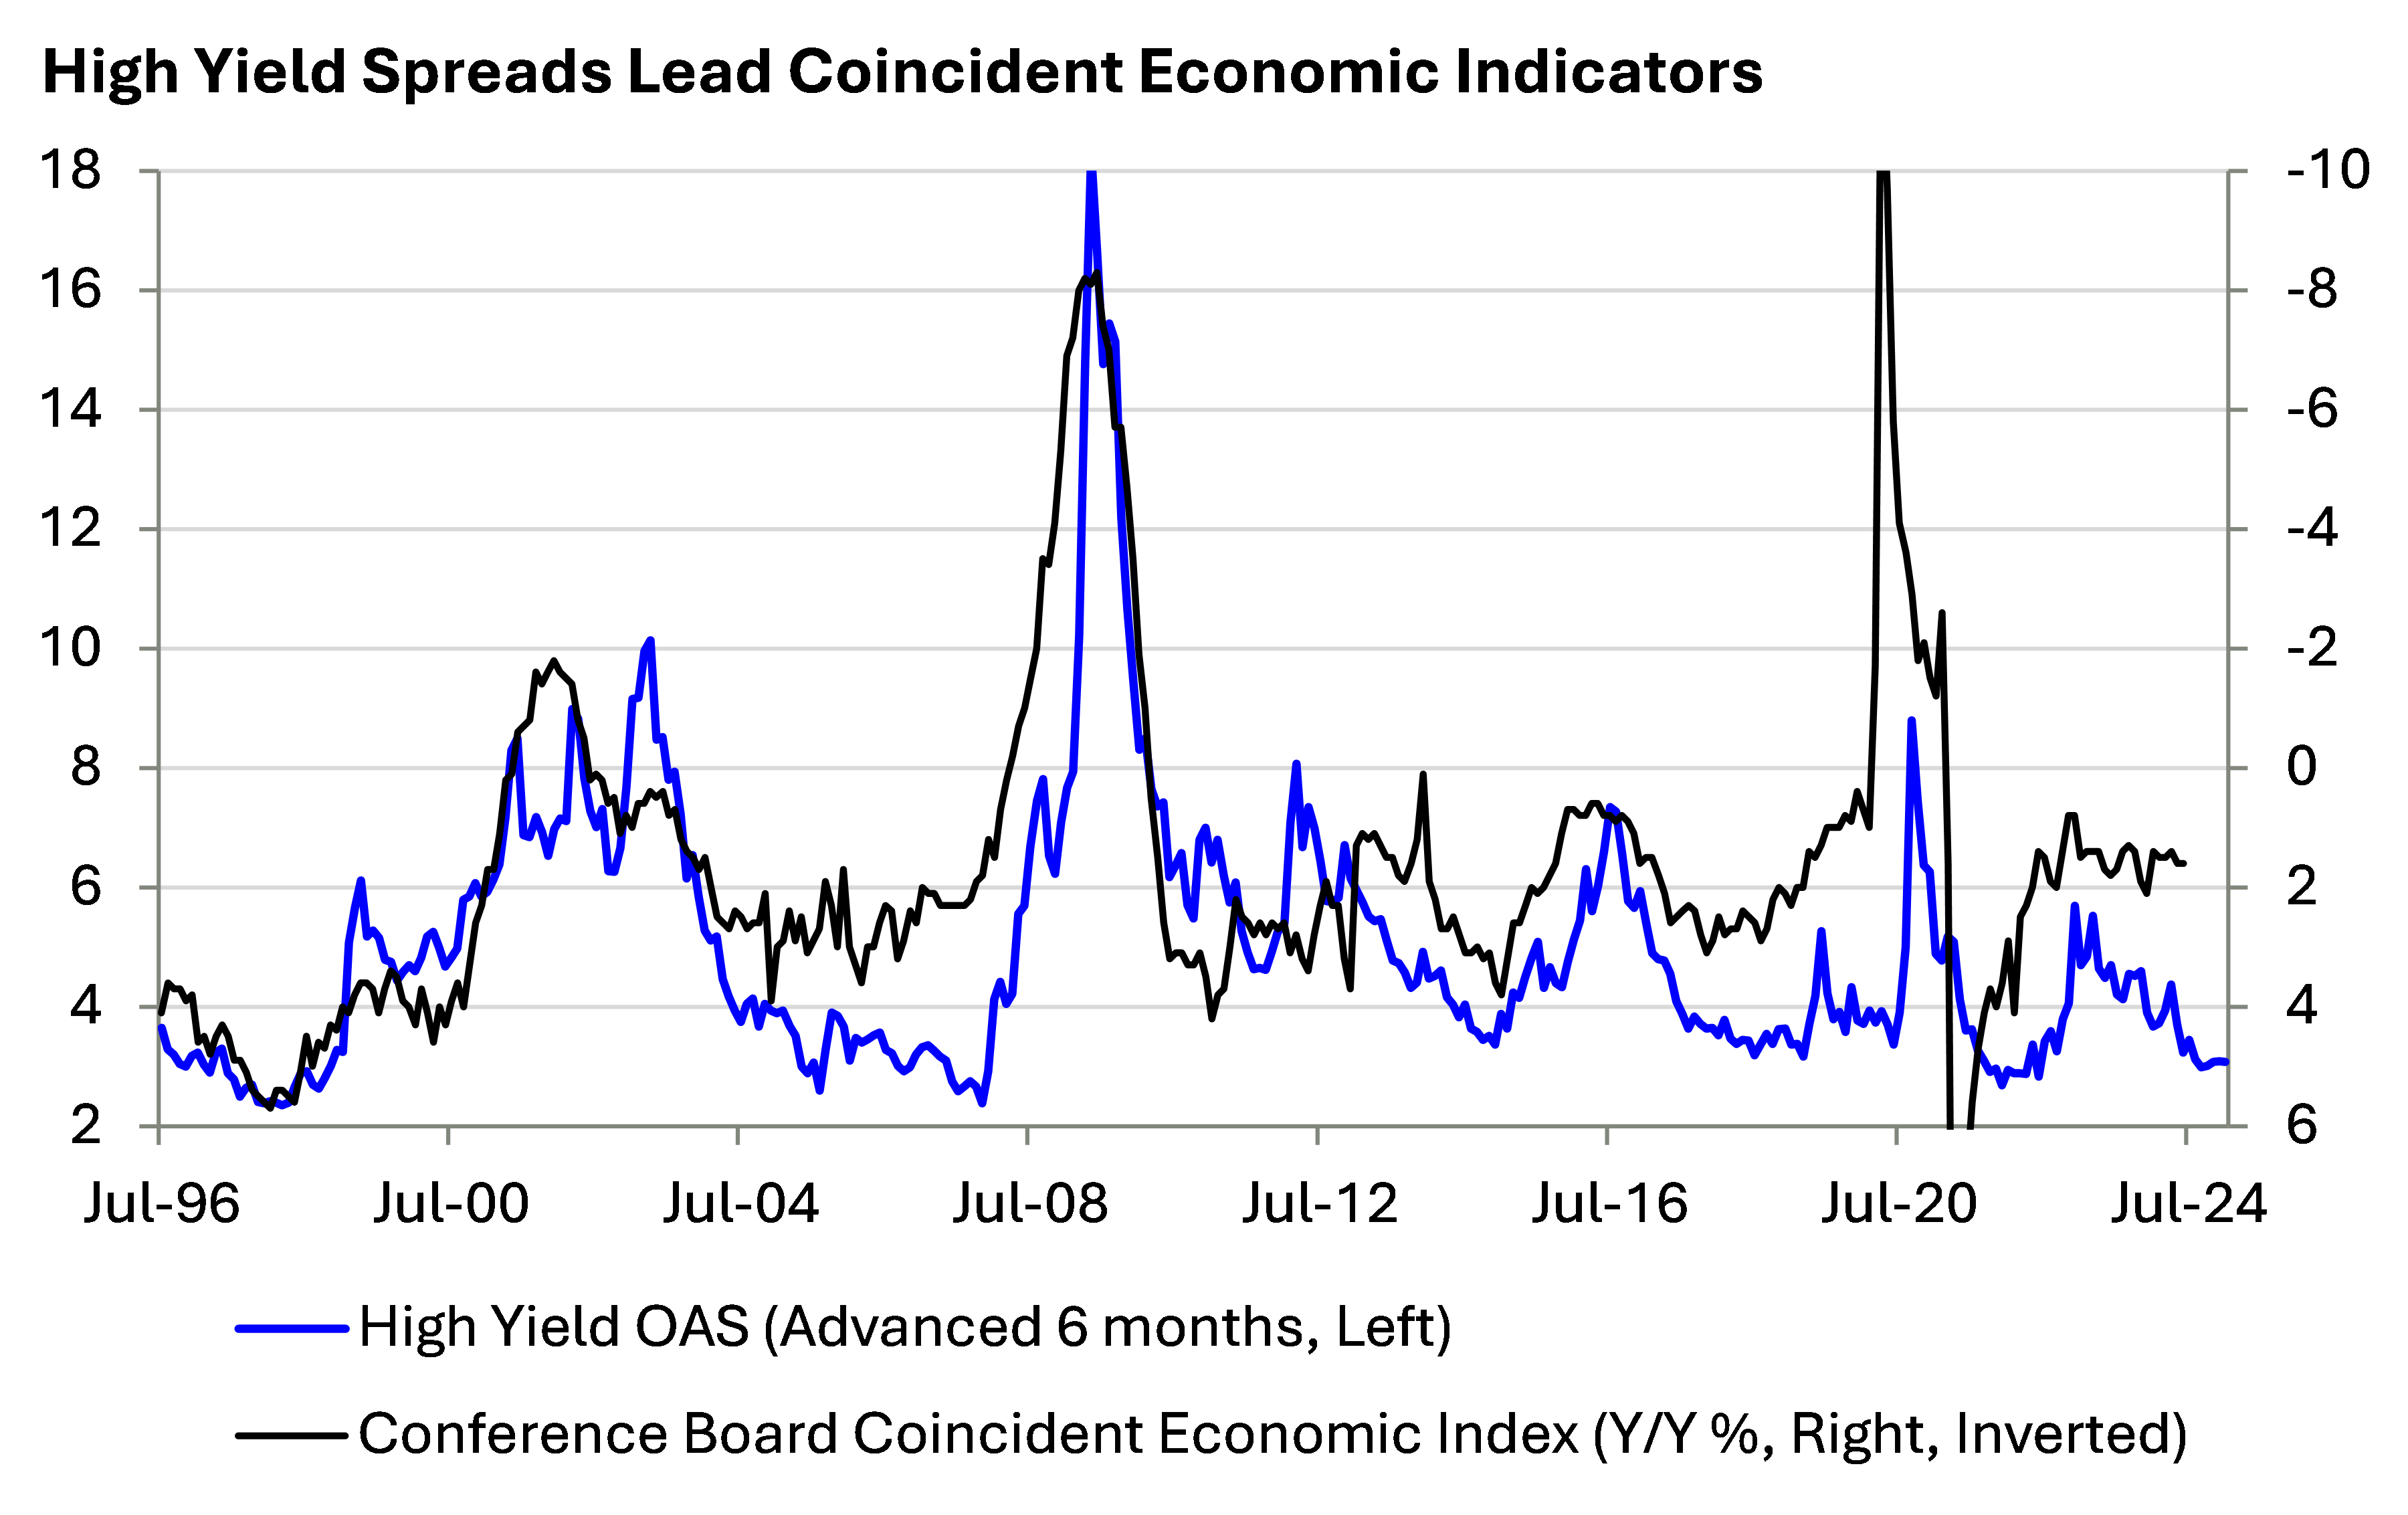
In fact, High Yield spreads themselves are considered leading economic indicators, sniffing out stress in the economic cycle often before it shows up in broader macroeconomic data. Today’s wider spreads could be signaling softer growth in the coming months.
The chart below shows this dynamic, with the High Yield spread leading the Conference Board Coincident Economic Index (CEI) by six months. Note in this chart that, like Maverick, the CEI is inverted.
As of 7/11/24
“Spreadin’ Out Her Wings Tonight”: High Yield’s Role in Portfolios
Though today’s “priced for perfection” tight spreads raise the risk that High Yield spreads could widen, leading the asset class to underperform in the short term, it is important to note that High Yield bonds remain a strategic asset class, in our view. Our long-term capital market assumption for the asset class is for lower returns than U.S. large-cap equities but with only a little over half of their volatility, making it, in our opinion, worth owning in almost any market environment.
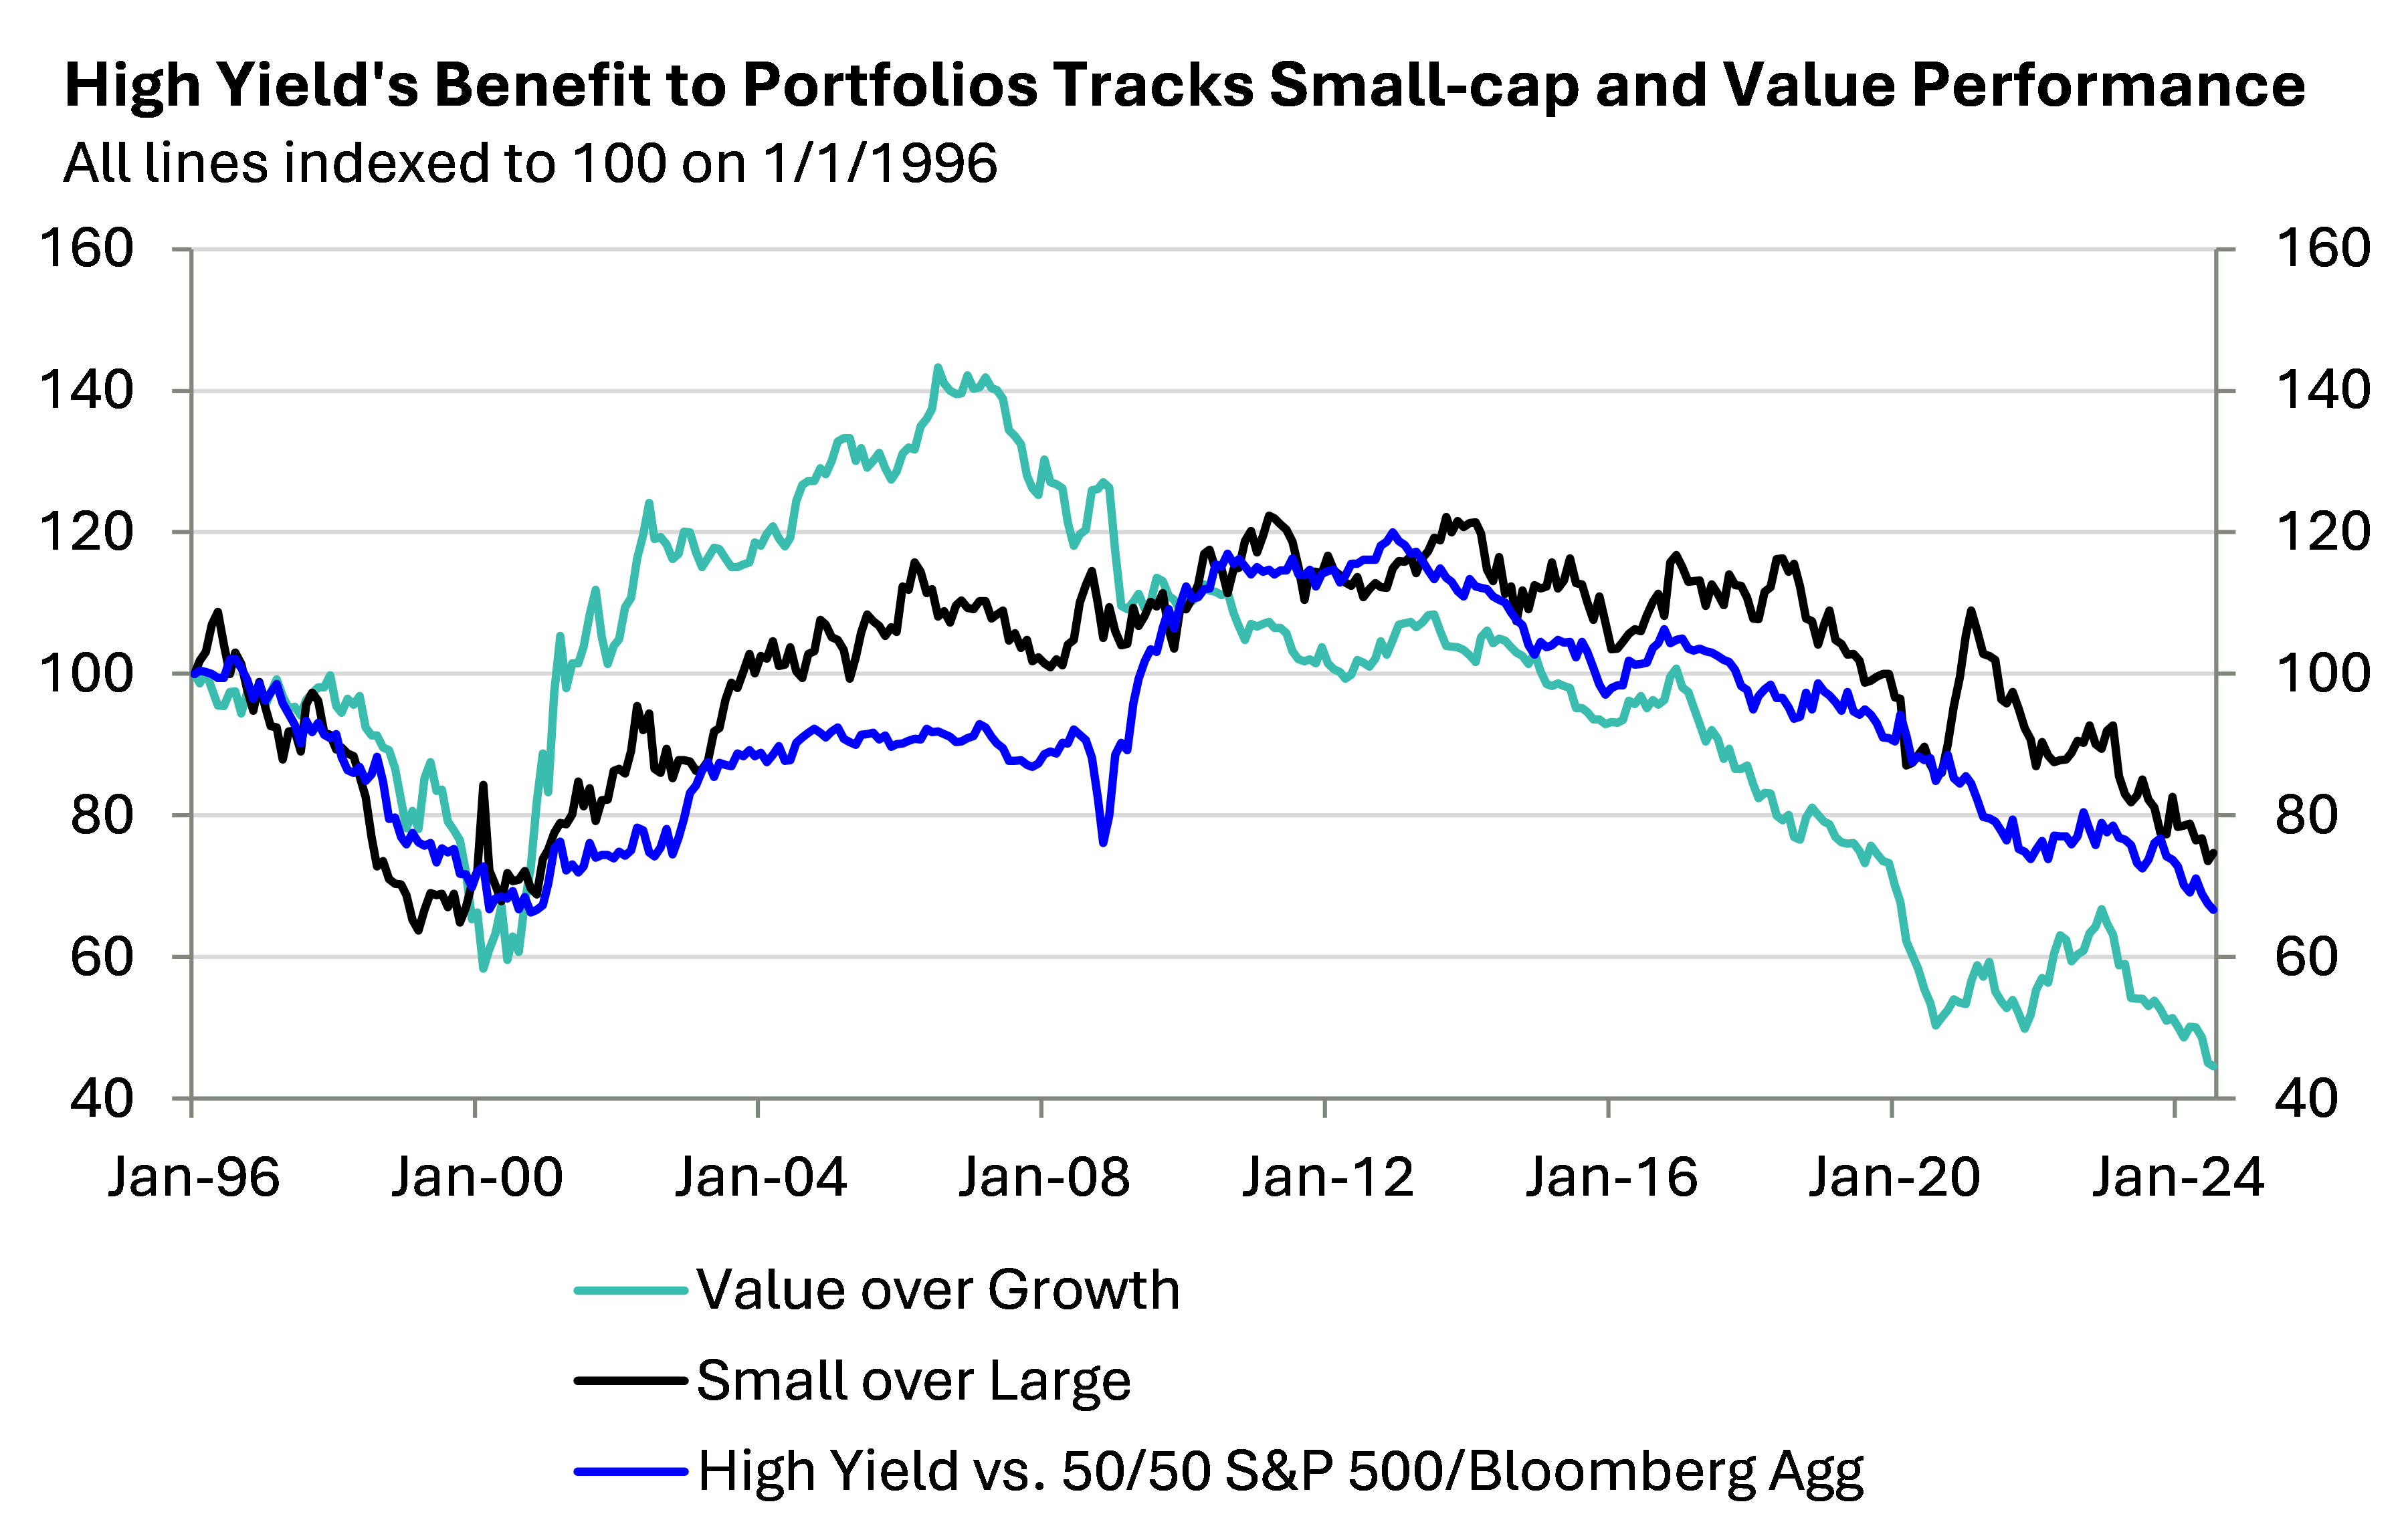
However, it is important to note that High Yield tends to add the most value to diversified portfolio returns when the economy is recovering from a downturn and is heating up, compared to today’s backdrop of slowing late-cycle growth. This early cycle “need for speed” dynamic explains their tight fit with the relative performance of small-cap and value stocks, which also tend to perform better early in an economic recovery.
As of 7/11/24
High Yield should deliver positive returns if our “muddle through”, slowing not collapsing outlook for U.S. economic growth is correct. But asset allocation is about seeking to maximize risk-adjust returns by acquiring attractively valued assets, and the compensation for the considerable credit risk investors occur for the risk of owning High Yield is lower than normal. This implies that High Yield positions in diversified portfolios should be somewhat below their longer-term targets.
“Metal Under Tension”: The Historical Performance of High Yield and Where Investors Are Getting Compensated
High Yield did not hold up well during the Global Financial Crisis, a time when investors valued safety, quality and liquidity in their portfolios. It underperformed U.S. equities on a risk-adjusted basis throughout most of 2008 before leading the recovery beginning in early 2009.
The 2010s were marked by very low yields and mostly tight spreads outside of a few stressful periods, but High Yield generally performed well during the low and slow recovery from the 2008 crises. The late 1990s and mid-2000s provide a more apt comparison to today. In both periods, the Fed had finished hiking rates and was preparing to cut them, and economic growth had softened or was just about to.
As of 7/11/24
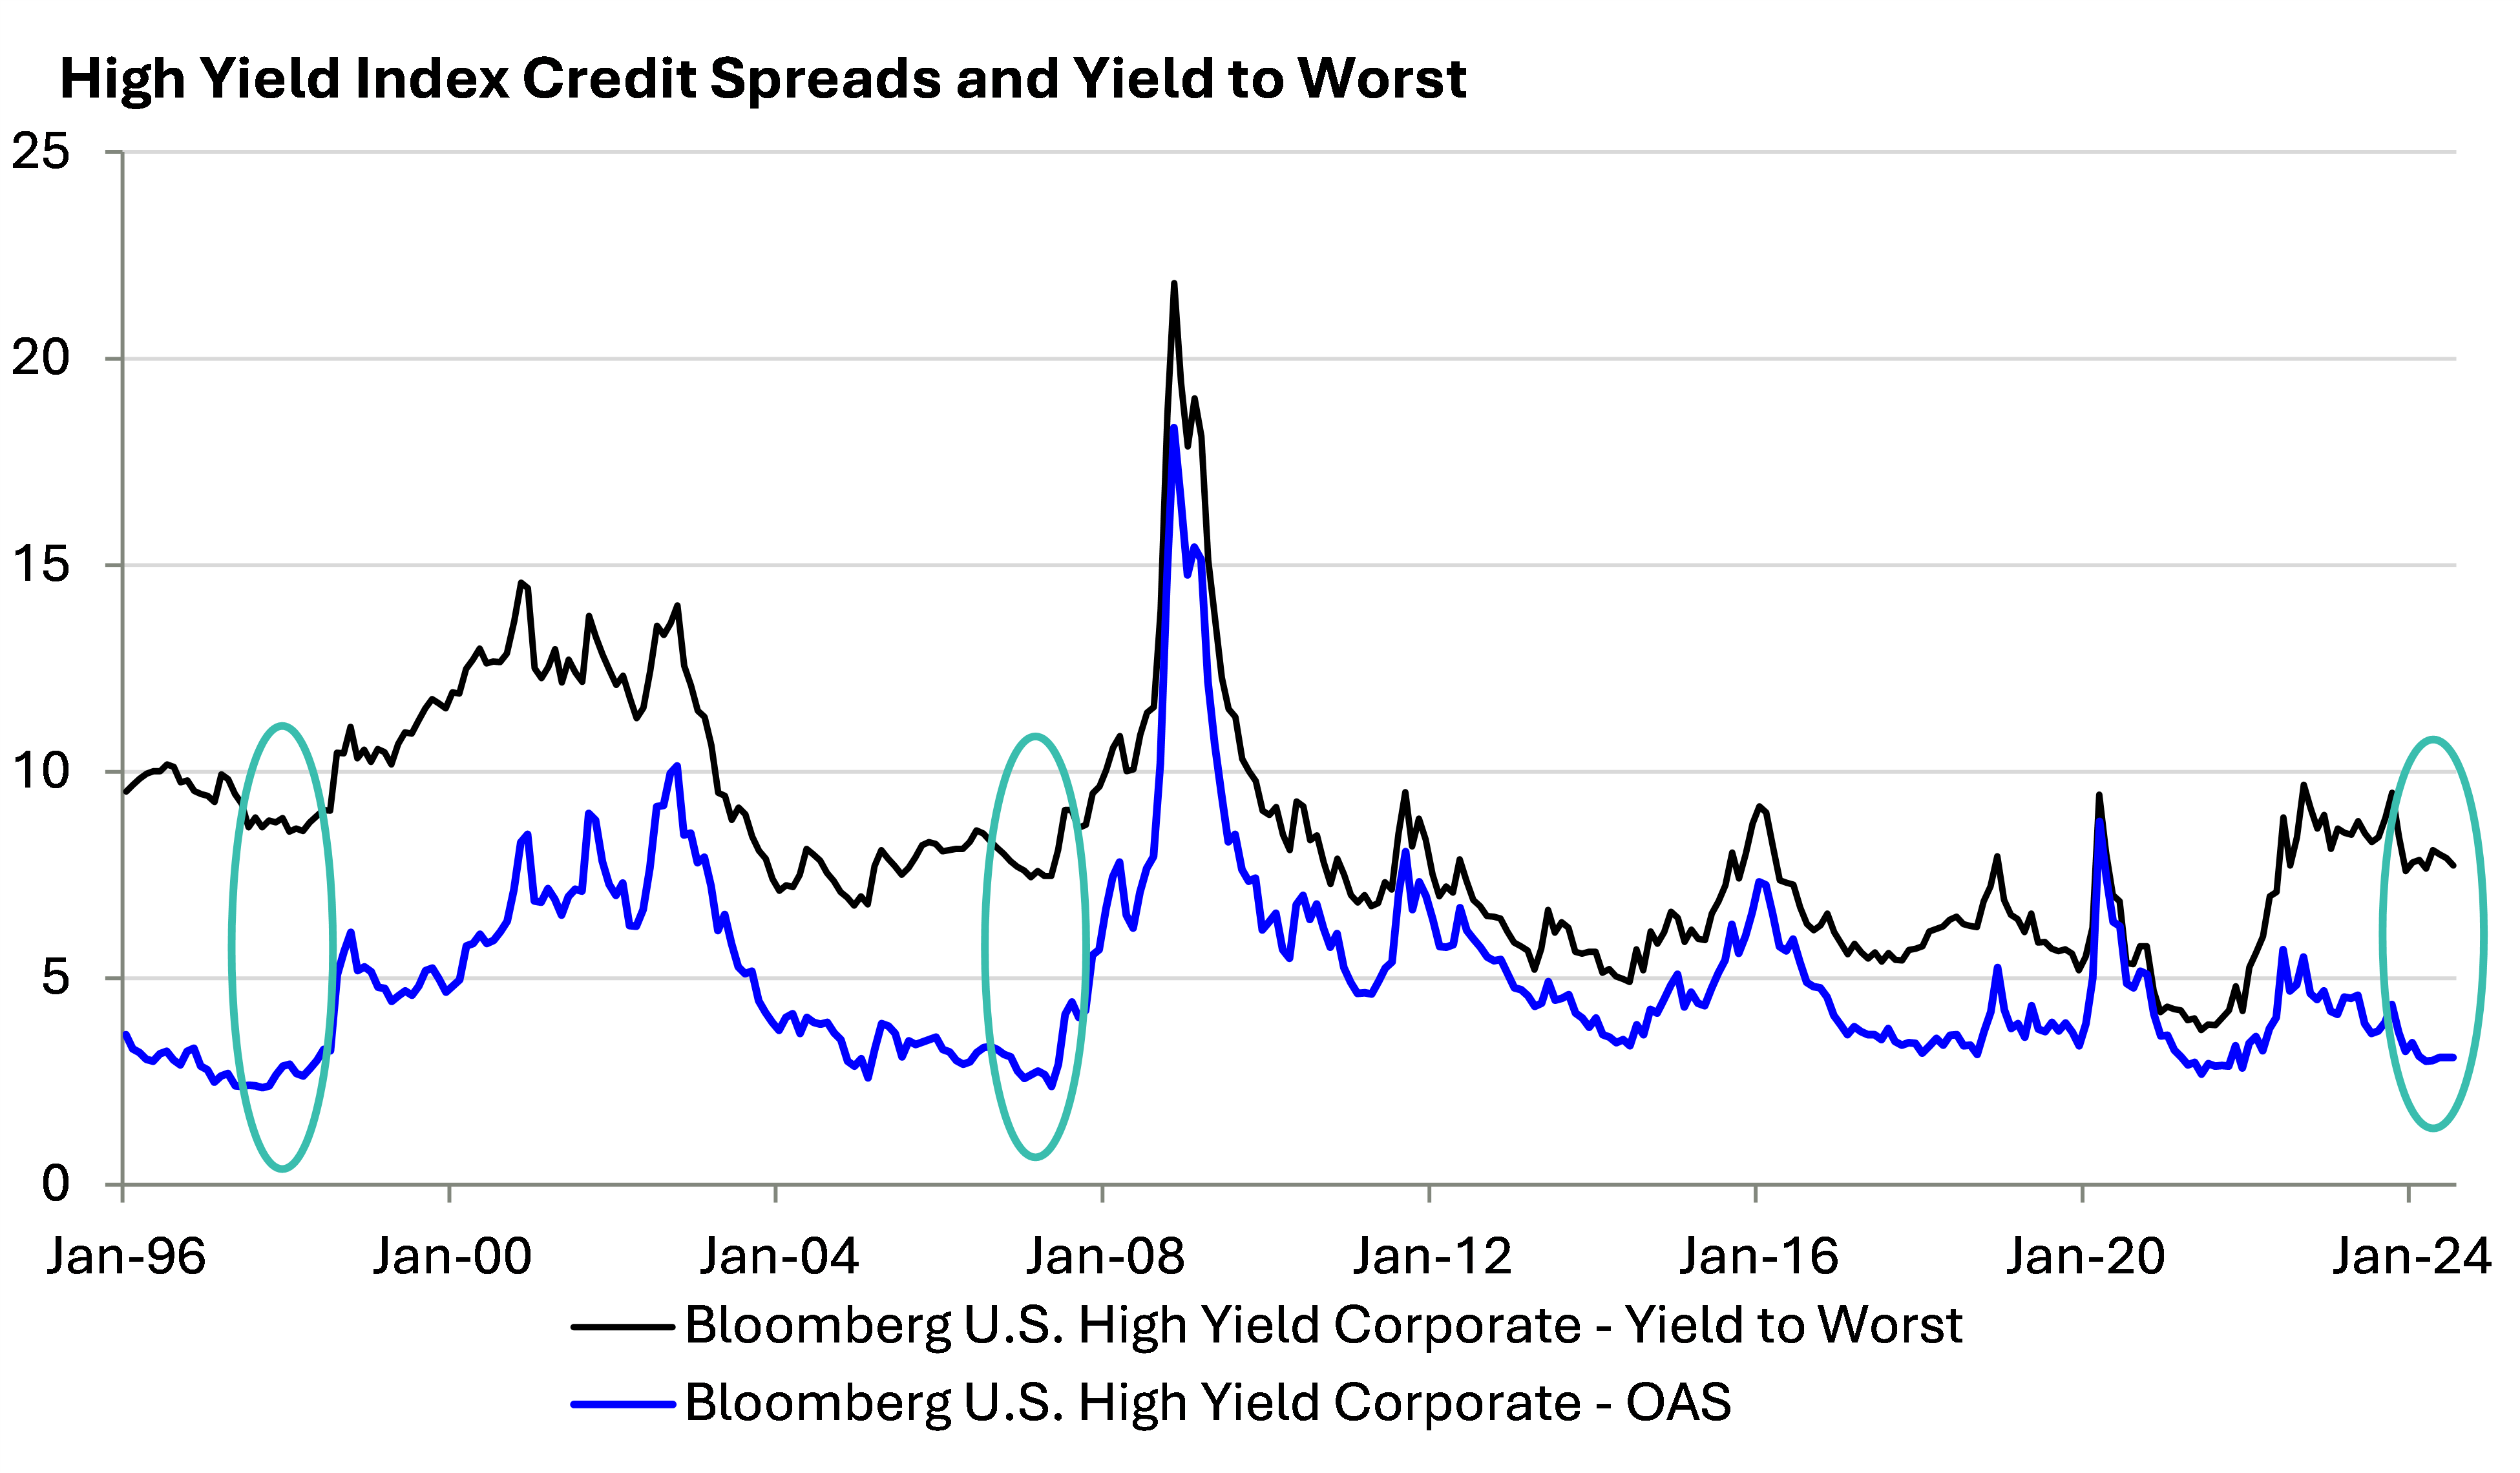
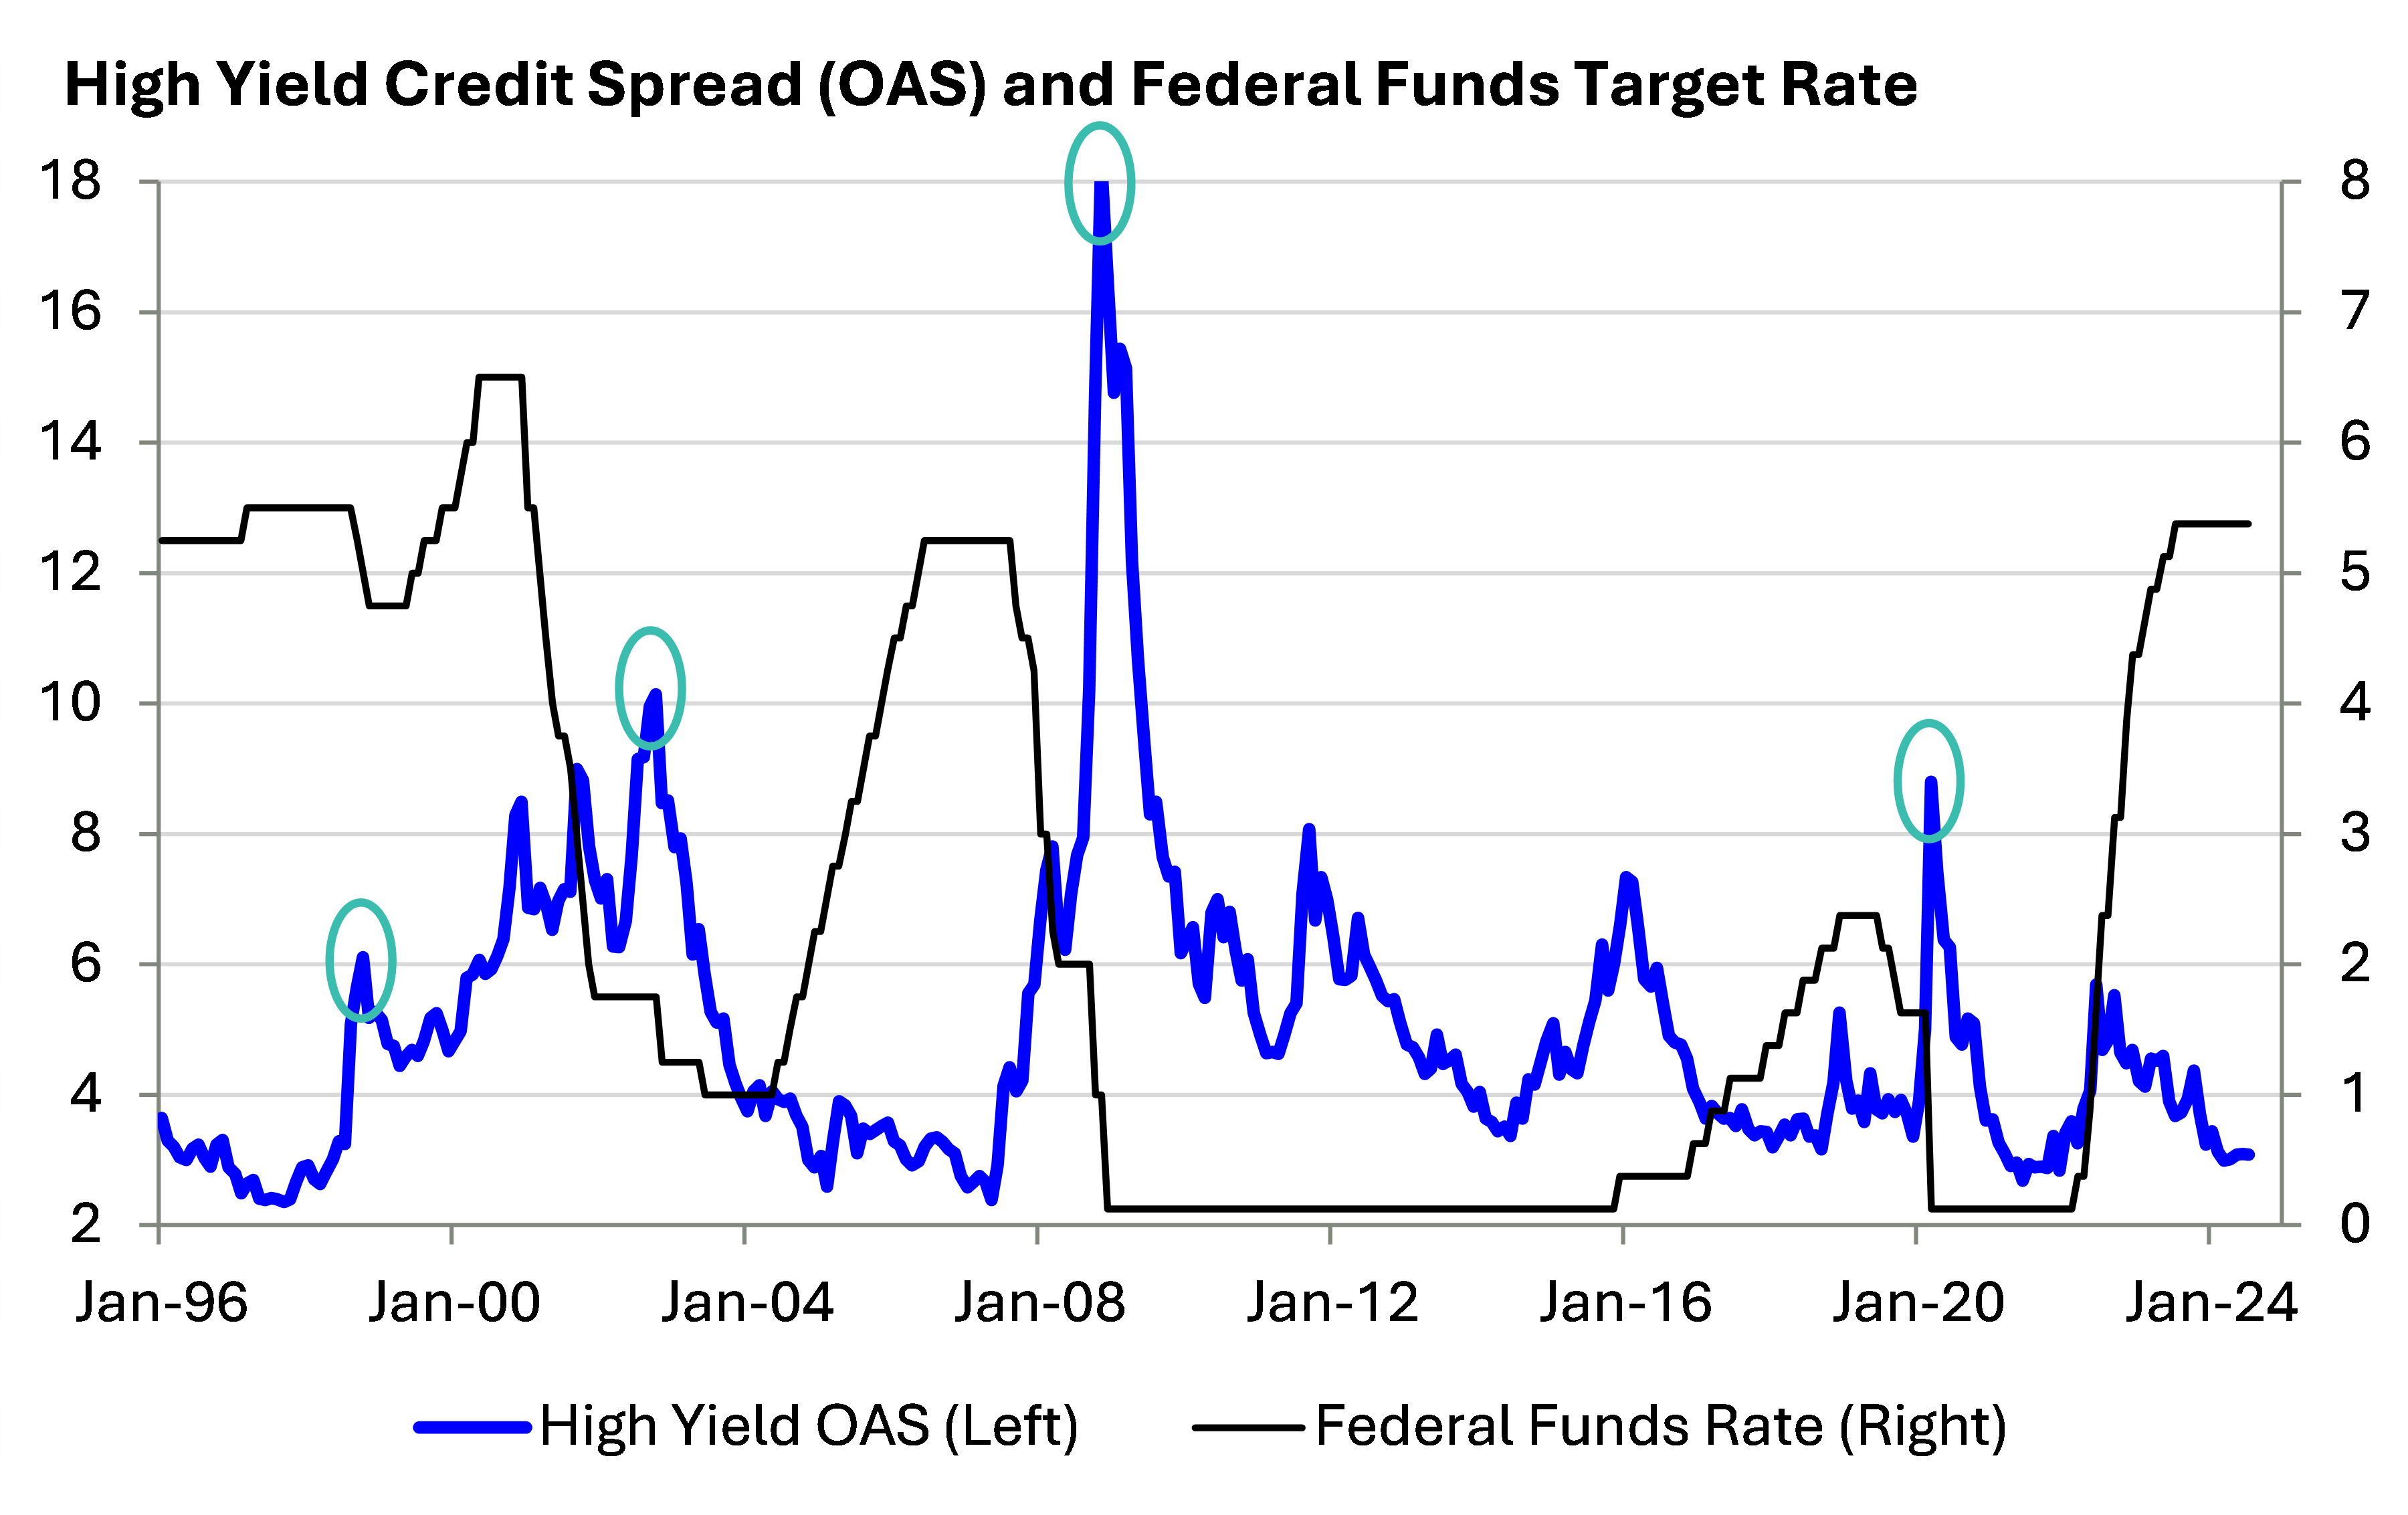
Bonds compensate investors for both credit risk and interest rate risk, though the mix fluctuates depending on the sector and the environment. Currently, High Yield investors are being rewarded handsomely for interest rate risk – as they are for holding pretty much all longer duration bonds – but not as generously for credit risk. The green circles highlighting the gaps between the blue and black lines on the graph above show this well.
The bulk of High Yield’s 7.9% coupon comes from the high level of underlying interest rates, while current credit spreads are unusually tight and likely to widen further from here. For a look at how High Yield would perform in that scenario, we need only look at history:
As of 7/11/24
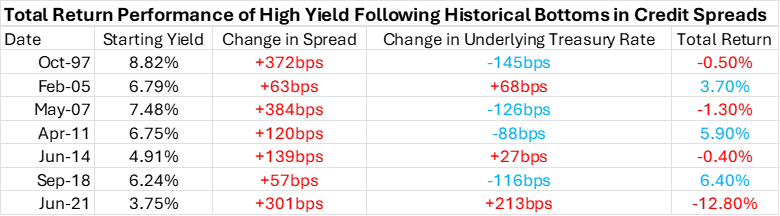
As the table above shows, historically, when High Yield spreads widen, their total returns over the next year typically fall short of their coupon rates at purchase. The size of the shortfall depends on: (a) the magnitude of the spread widening; and (b) the extent to which falling interest rates offset wider spreads. The first is directly related to the macro environment (bigger slowdown = wider spreads) while the second is a function the Fed’s ability and willingness to cut interest rates, along with a flight to safety for risk-free bonds like Treasuries.
The worst of all worlds occurred between the second half of 2021 and the first half of 2022, when rising inflation and growth fears led to interest rate volatility, causing spreads to widen just as underlying rates were spiking. That’s unlikely to repeat in 2024 or 2025, but a scenario more akin to the ones that began in 1997 or 2007, when High Yield returns turned negative, is a risk. Notably, in both periods, spreads widened further even after the Fed began to cut interest rates:
As of 7/11/24
As we said above, a muddle-through market environment in which growth slows but stops short of a recession would likely be fine for High Yield returns, though other asset classes like equities and core bonds would probably perform better. But given its rich starting point, in a moderate to severe recession, High Yield could perform worse than equities on a risk-adjusted basis, as it did in 2008. It would also struggle should a return to high inflation unsettle bond markets a la 2022.
The flip side of our growing caution on High Yield is a stronger preference for higher quality taxable bonds, including both Treasuries and Investment Grade Corporates. Both carry more interest rate risk, which was toxic to portfolios in 2022 and 2023 but could become a tailwind as growth slows and the Fed moves into easing mode.
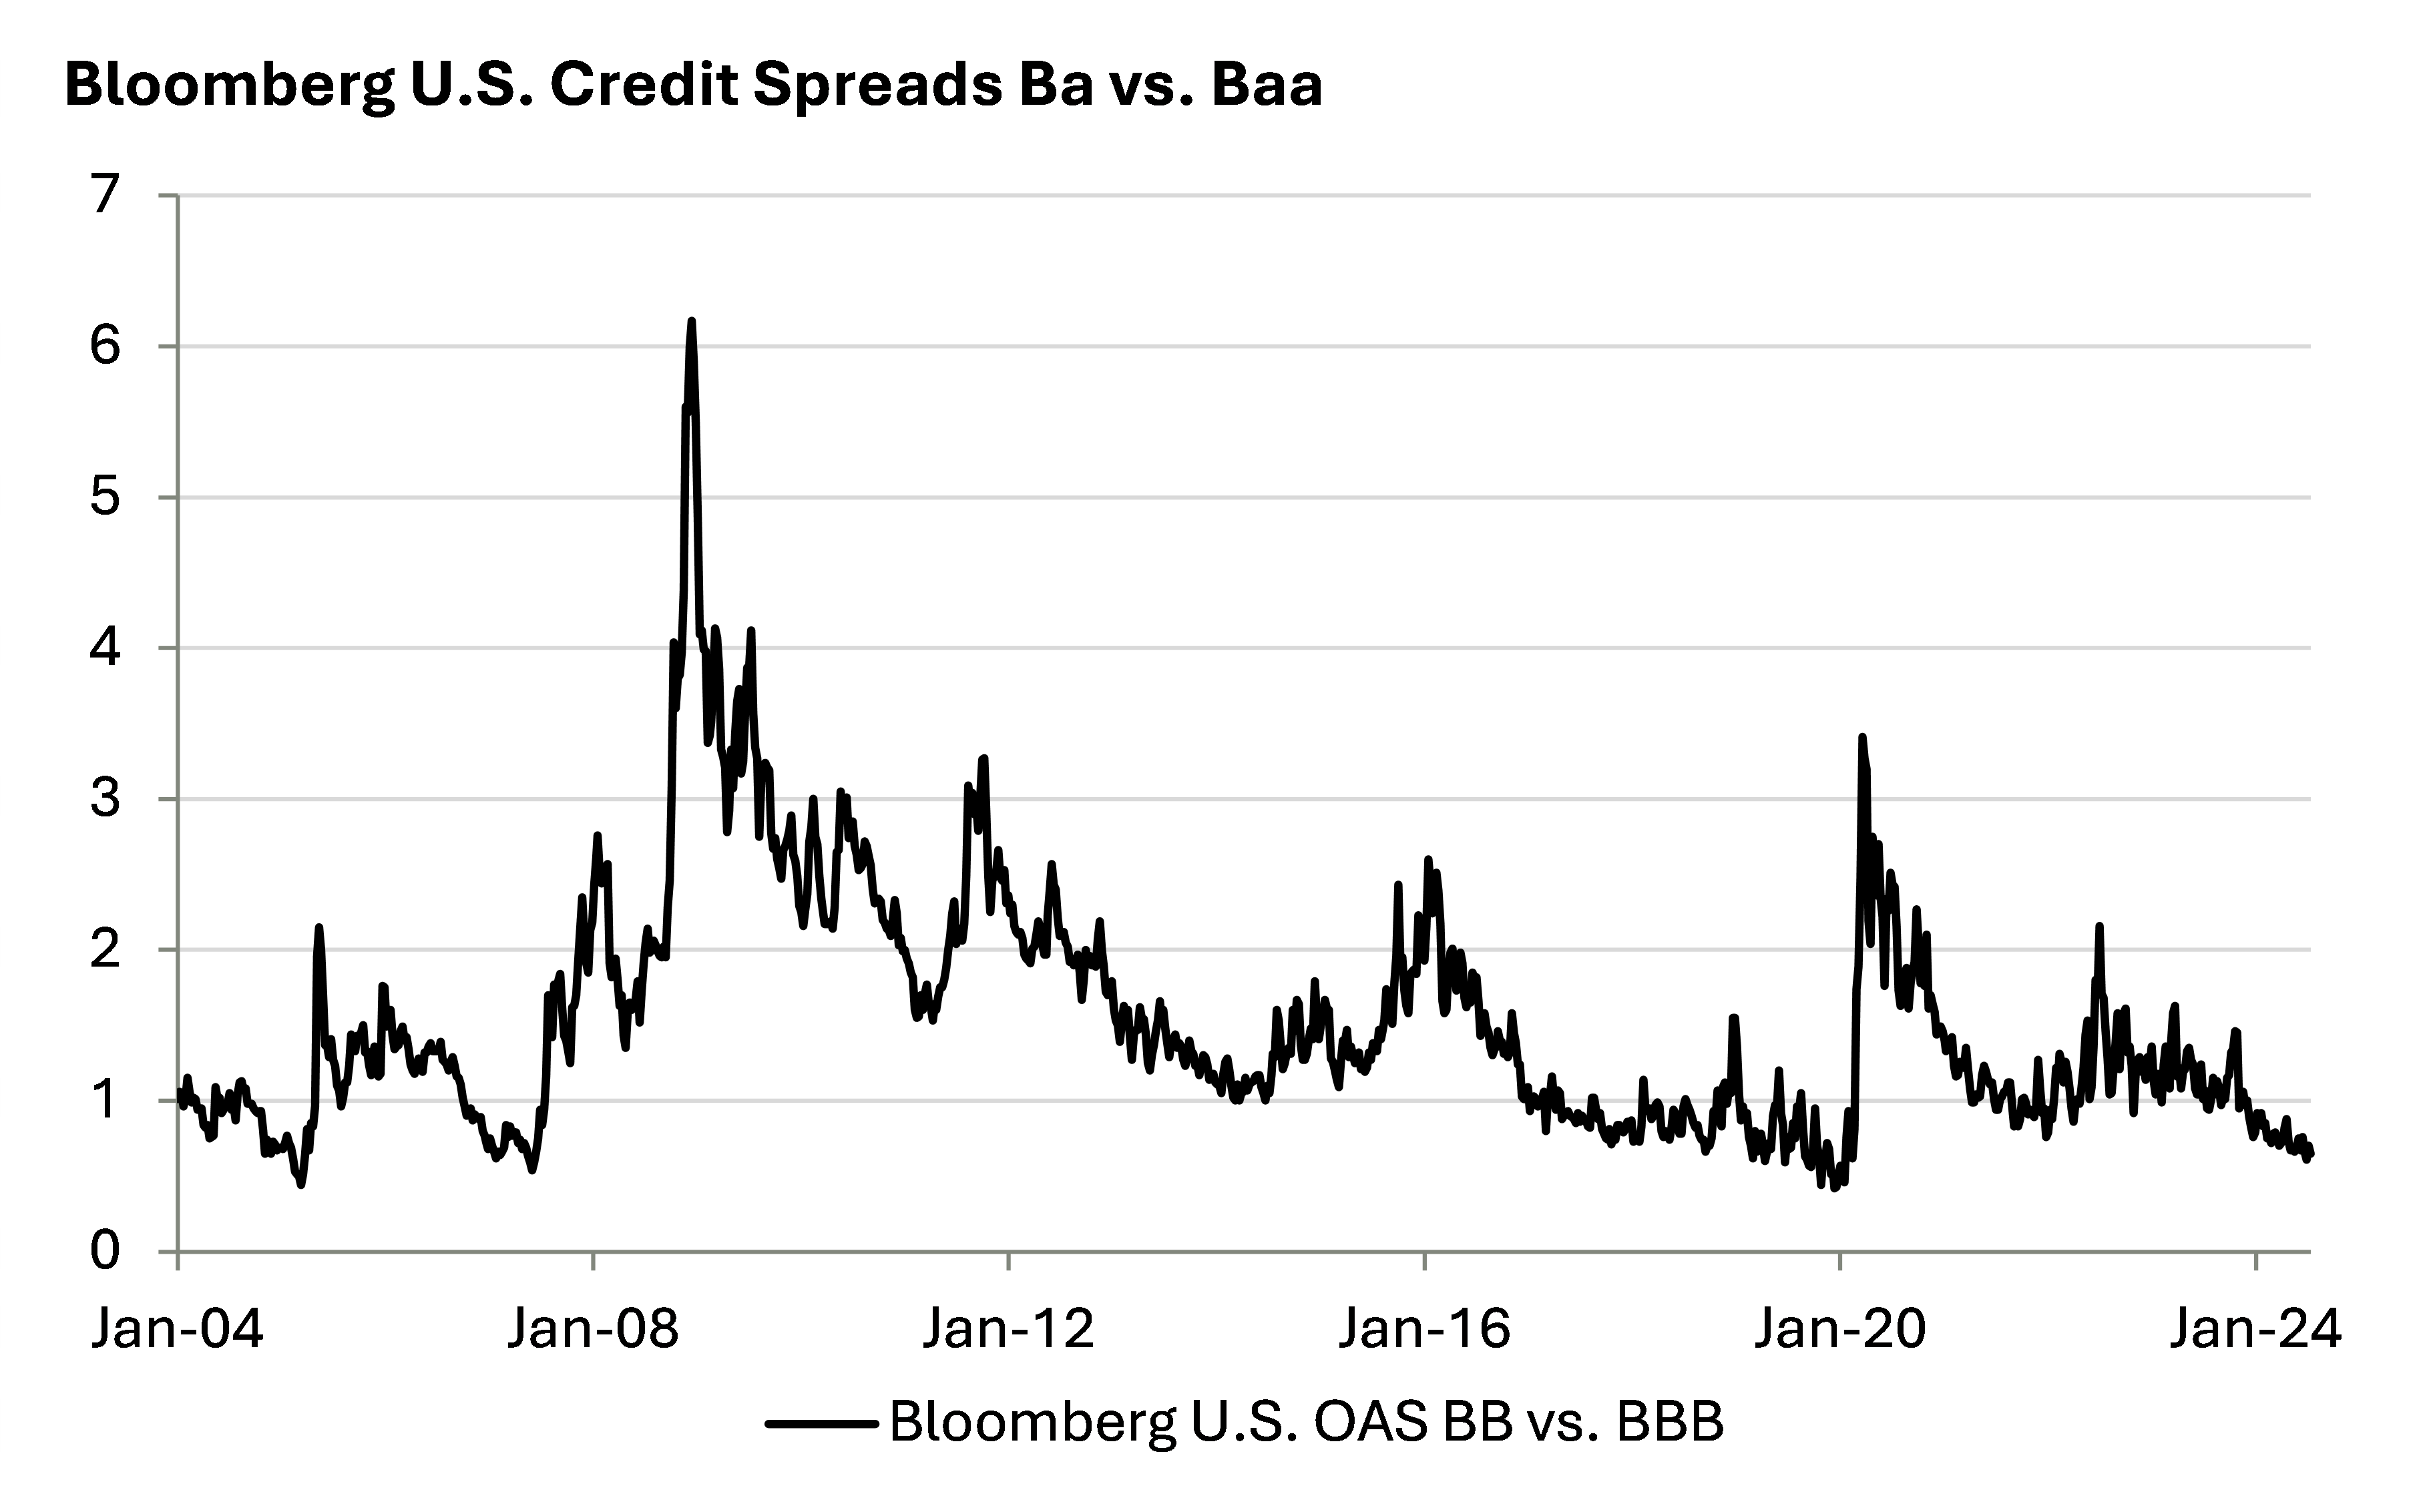
In addition, the spread “give up” for moving up in credit quality is just about as small as it’s ever been, as shown below by the spread between the lowest grade part of the Investment Grade index (Baa) and the highest grade part of the High Yield index (Ba).
As of 7/11/24
Rather than taking the risk of “buzzing the tower” by holding too much credit risk in bond portfolios, we think it’s time for investors to “turn and burn” into other asset classes. High Yield still plays a role in long-term investment allocations, but for investors looking to put new capital to work, we see it as prudent to focus on higher quality parts of the fixed income market.
IMPORTANT DISCLOSURES
Index Information: All returns represent total return for stated period. The BBB IG Spread is the Bloomberg Baa Corporate Index that measures the spread of BBB/Baa U.S. corporate bond yields over Treasuries. The HY OAS is the High Yield Option Adjusted Spread index measuring the spread of high yield bonds over Treasuries. The Conference Board’s Coincident Economic Index (CEI) is a monthly composite estimate of current economic performance in the U.S. The Index is made up of components that reflect employment, household income, industrial output, and business revenue. The Bloomberg US Corporate High Yield Bond Index measures the USD-denominated, high yield, fixed-rate corporate bond market.
The views and opinions included in these materials belong to their author and do not necessarily reflect the views and opinions of NewEdge Capital Group, LLC.
This information is general in nature and has been prepared solely for informational and educational purposes and does not constitute an offer or a recommendation to buy or sell any particular security or to adopt any specific investment strategy.
NewEdge and its affiliates do not render advice on legal, tax and/or tax accounting matters. You should consult your personal tax and/or legal advisor to learn about any potential tax or other implications that may result from acting on a particular recommendation.
The trademarks and service marks contained herein are the property of their respective owners. Unless otherwise specifically indicated, all information with respect to any third party not affiliated with NewEdge has been provided by, and is the sole responsibility of, such third party and has not been independently verified by NewEdge, its affiliates or any other independent third party. No representation is given with respect to its accuracy or completeness, and such information and opinions may change without notice.
Investing involves risk, including possible loss of principal. Past performance is no guarantee of future results.
Any forward-looking statements or forecasts are based on assumptions and actual results are expected to vary from any such statements or forecasts. No assurance can be given that investment objectives or target returns will be achieved. Future returns may be higher or lower than the estimates presented herein.
An investment cannot be made directly in an index. Indices are unmanaged and have no fees or expenses. You can obtain information about many indices online at a variety of sources including: https://www.sec.gov/answers/indices.htm.
All data is subject to change without notice.
© 2024 NewEdge Capital Group, LLC
The post High Yield on the Highway to the Danger Zone? appeared first on NewEdge Wealth.