
Well, maybe
What you need I hope it finds you
“An Ode to Maybe” – Third Eye Blind
Harry Truman once asked to be sent a one-armed economist, frustrated with the profession’s propensity to condition every assessment with “on the one hand this… while on the other hand that…”.
In our 2H24 Outlook assessment of the recent rotation in equity markets away from the narrow Magnificent 7 leadership in to “left behind” areas (small caps, Value, international, etc.), we may be disappointing Truman by remaining fully-limbed, offering a conditional outlook for whether these rotations can continue beyond an initial positioning snapback.
Instead of listening to Truman’s favorite classical piano, we are listening to our favorite Third Eye Blind, “An Ode to Maybe”, suggesting that maybe rotations can continue, but that it is highly dependent on the path of both yields and earnings growth.
“And I’m wondering how I got here”: Positioning Squeeze
Over the last two weeks, the Russell 2000 Small Cap index put up its best 5-day winning streak since 2020, soaring 12% in a blink of an eye.
The spark for this powerful move was the July 11th softer PCE inflation data that led to a plunge in yields and a jump in bets that the Fed could begin its interest rate cutting cycle within the next two months. Recall that the Russell 2000 has much higher usage of floating rate debt (3x as much as the S&P 500), so in theory, lower yields could provide relief to small cap balance sheets and earnings by lowering interest expense.
The massive magnitude of the small cap move was due to this lower yield spark landing on a veritable pile of tinder covered in lighter fluid: positioning in small caps was incredibly short/light going into the July 11th data.
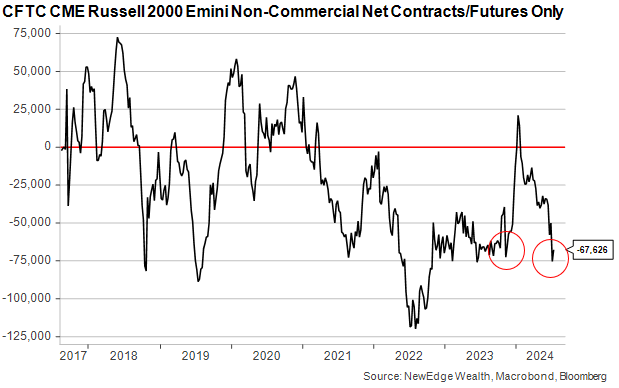
The chart below shows the short positioning that traders have in Russell 2000 futures. Note the similar degree of short positioning that was reached in 2023 prior to the Russell’s 20% rally in November and December as traders scrambled to cover shorts and flipped positioning long. When this data gets updated next (the most recent data is 7/9/24), it is likely to register a big jump higher as traders cover their shorts.
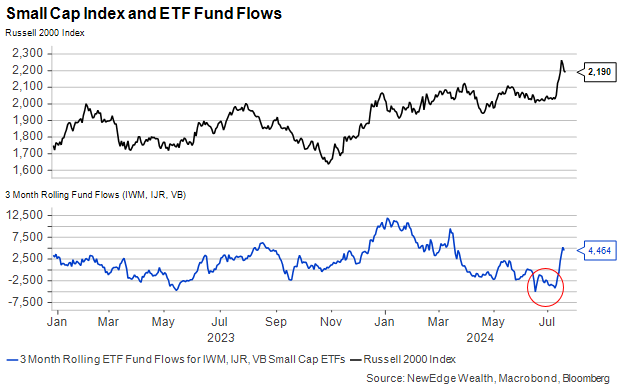
A similar picture can be painted with ETF flows below, where investors gave up on small caps, dumping ETF positions into early July. This data is more up-to-date and captures the recent jump higher in the stocks and the clamoring of investors to get back into the small cap trade.
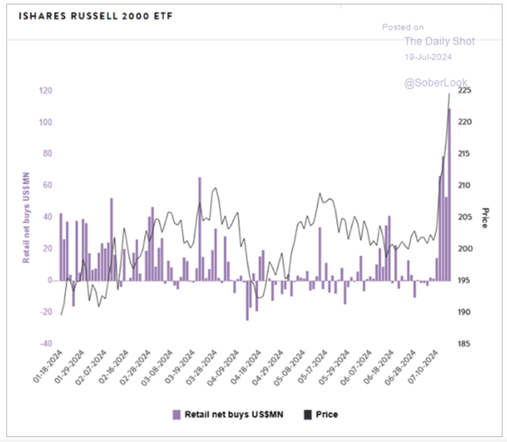
The chart below illustrates the sheer magnitude of the recent positioning snapback/chase, with huge retail flows into the IWM small cap ETF.
We think there is still room for positioning to normalize further in response to the recent move, given the degree of the underweight position that many investors have/had to the small cap space. This suggests that there could be more short-term upside to the small cap trade, but what happens after positioning becomes more balanced? Can the small cap leadership continue?
This is where we break out our two hands, get conditional, and sing along with 3EB.
“I needed this more than I knew”: Yields Falling for Good Reasons Are Necessary
As mentioned above, small caps are highly dependent on the path of yields given their debt-laden balance sheets and exposure to floating rates.
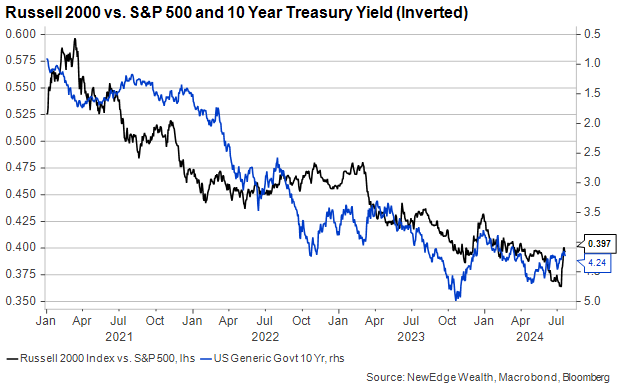
The chart below shows this inverse relationship with the relative performance of the Russell 2000 vs. the S&P 500 and the 10 Year Treasury yield. Higher rates over the past three years have coincided with startling underperformance of small caps vs. large caps as higher interest expense has weighed on small cap profitability.
For small cap leadership to continue, it is likely imperative that yields continue to fall, but there is a big caveat here: yields need to be falling for good reasons not bad reasons.
If yields are falling just because inflation is continuing to moderate and the Fed is starting to cut rates, then this is a beneficial backdrop for small caps. It suggests a Soft Landing (falling inflation with no recession), where small caps get relief on their balance sheets due to lower interest expense, all the while profits aren’t pressured thanks to a resilient economic growth backdrop.
However, if yields are falling because of lower inflation, Fed cuts, AND weaker growth, then this would be a challenge for small caps. Even with today’s resilient economic growth backdrop, 40% of the Russell 2000 is unprofitable, with the risk being that profitability could plunge further if economic growth were to stumble.
If yields start to climb again, say due to fiscal deficient spending, higher inflation, or potential post-election policy changes, then it is likely that the small cap trade will run out of steam.
The conclusion is that small caps need lower yields, but it must be for the right reasons.
“If I could bottle my hopes”: Earnings
The other thing that small caps need is improved performance in earnings.
The table below shows consensus earnings estimates for various indices for 2024 and 2025.
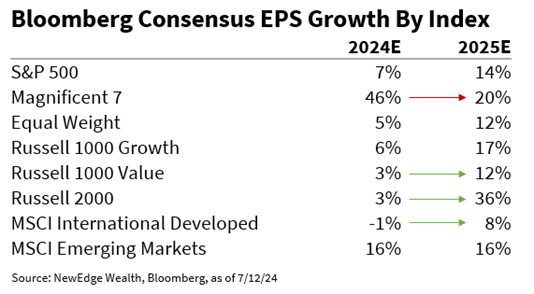
The Russell 2000’s measly +3% EPS growth estimate for 2024 earnings trails large cap indices but note the big expectation for a recovery in earnings growth in 2025 to +36%. Talk about “bottled up hope”!
This may seem encouraging on the surface as a sign that a recovery in the stocks is supported by an improvement in earnings fundamentals. But the reality is that small cap earnings have been particularly prone to being revised lower.
In fact, the +3% growth expected for small cap 2024 earnings today was for +24% at the start of the year! Investors expecting small caps to deliver market-leading earnings growth in 2024 have been sorely disappointed as revisions lower have been relentless.
The table below shows this path of revisions lower for small cap earnings and contrasts it with revisions higher for leading indices like Growth.
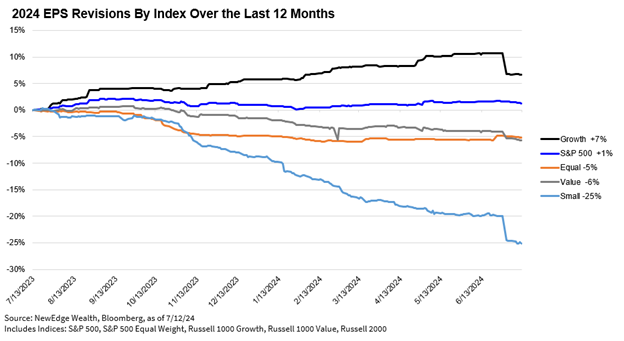
For small caps to have sustained outperformance, we think it is imperative for earnings revisions to improve. This means that small caps need to deliver on these lofty +36% growth estimates for 2025 earnings in order to outperform large cap indices. The challenge is that small cap earnings estimates are starting from such a high level.
Catalysts for better small cap earnings and sentiment could include: falling yields that ease interest rate costs and help regional banks (Financials are 18% of the Russell 2000), a revival of M&A activity thanks to the expectations for rate cuts, and an improvement in cyclical economic activity, such as in industrial manufacturing (Industrials are 17% of the Russell 2000).
“’Cause It seems somehow, I keep getting stuck in the mire”: Conclusion
Included in our 2H24 Outlook was an upgrade of small caps from our long-held “underweight” tactical allocation to “neutral”. The rationale for this upgrade is detailed in Slide 38 of the deck. The summary of the upgrade is that that positioning is offsides enough to support a relief rally in the segment, while our expectation for slowing, but still resilient economic growth in the short term would provide a safe backdrop for this positioning rebalance to continue.
Given our “ode to maybe” that, in order for the rally to continue, yields have to fall, growth has to remain resilient, and earnings have to deliver, we put a short window on this tactical move of 3-6 months, with constant reassessment.
So, in the short term, small caps have the potential to continue their bounce but a lot has to go right for the small cap rally to continue beyond this initial positioning rebound. Sorry Truman!
IMPORTANT DISCLOSURES
Index Information: All returns represent total return for stated period. S&P 500 is a total return index that reflects both changes in the prices of stocks in the S&P 500 Index as well as the reinvestment of the dividend income from its underlying stocks. The NASDAQ Composite Index measures all NASDAQ domestic and international based common type stocks listed on the Nasdaq Stock Market. Russell 2000 is an index that measures the performance of the small-cap segment of the U.S. equity universe. MSCI International Developed measures equity market performance of large, developed markets not including the U.S. MSCI Emerging Markets (MSCI Emerging Mkts) measures equity market performance of emerging markets. Russell 1000 Growth Index measures the performance of the large- cap growth segment of the US equity universe. It includes those Russell 1000 companies with relatively higher price-to-book ratios, higher I/B/E/S forecast medium term (2 year) growth and higher sales per share historical growth (5 years). The Russell 1000 Value Index measures the performance of the large cap value segment of the US equity universe. It includes those Russell 1000 companies with relatively lower price-to-book ratios, lower I/B/E/S forecast medium term (2 year) growth and lower sales per share historical growth (5 years).
The views and opinions included in these materials belong to their author and do not necessarily reflect the views and opinions of NewEdge Capital Group, LLC.
This information is general in nature and has been prepared solely for informational and educational purposes and does not constitute an offer or a recommendation to buy or sell any particular security or to adopt any specific investment strategy.
NewEdge and its affiliates do not render advice on legal, tax and/or tax accounting matters. You should consult your personal tax and/or legal advisor to learn about any potential tax or other implications that may result from acting on a particular recommendation.
The trademarks and service marks contained herein are the property of their respective owners. Unless otherwise specifically indicated, all information with respect to any third party not affiliated with NewEdge has been provided by, and is the sole responsibility of, such third party and has not been independently verified by NewEdge, its affiliates or any other independent third party. No representation is given with respect to its accuracy or completeness, and such information and opinions may change without notice.
Investing involves risk, including possible loss of principal. Past performance is no guarantee of future results.
Any forward-looking statements or forecasts are based on assumptions and actual results are expected to vary from any such statements or forecasts. No assurance can be given that investment objectives or target returns will be achieved. Future returns may be higher or lower than the estimates presented herein.
An investment cannot be made directly in an index. Indices are unmanaged and have no fees or expenses. You can obtain information about many indices online at a variety of sources including: https://www.sec.gov/answers/indices.htm.
All data is subject to change without notice.
© 2024 NewEdge Capital Group, LLC
The post An Ode to Maybe appeared first on NewEdge Wealth.